Getting Started with ModusToolbox:
Creating, Building, and Programming a PSoC 6 Project
Introduction
ModusToolbox is the official integrated development environment (IDE) from Infineon Technologies for developing applications for PSoC microcontrollers and wireless devices. It provides a complete ecosystem for project creation, peripheral configuration, source code development, debugging, and device programming.
This document explains the recommended workflow for creating, configuring, building, debugging, and programming a PSoC 6 project using ModusToolbox.
2.1. Preparing a Workspace
Before launching ModusToolbox for the first time, it is recommended to create a dedicated workspace directory for all PSoC projects.
A suggested directory structure is shown below:
[C:]/
|-- <org name>/
|   |-- PSoC6/
|   `-- PSoC6AI/
Using a dedicated workspace provides several advantages:
- Better project organization
- Easier backup and version control
- Separation from operating system files
- Simplified management of multiple projects
For users working on multiple courses or research projects, additional subfolders may be created as needed.
2.2 Launching ModusToolbox for the First Time
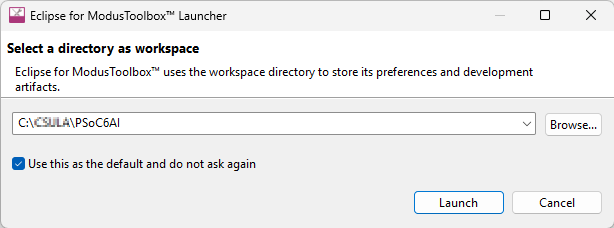
When ModusToolbox is launched for the first time, it will prompt for a Workspace location.
- Browse to the workspace folder created previously.
Example:
C:\CSULA\PSoC6 or C:\CSULA\PSoC6AI - Enable the option:
[✓] Use this as the default and do not ask again - Click Launch.
ModusToolbox will use this directory as the default workspace for all future projects.
2.3 Creating a New Project
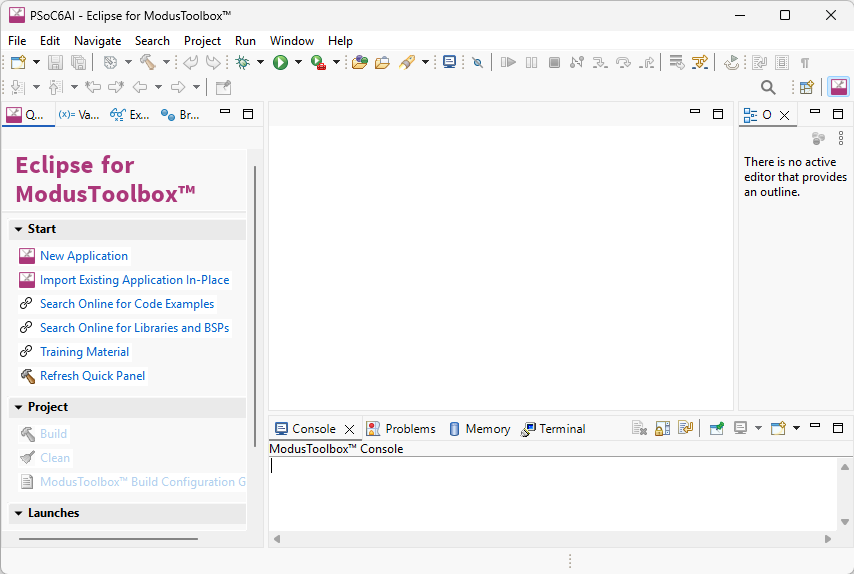
Step 1: Create New Application
- From the Quick Panel, click
 New Application to start the project creation wizard.
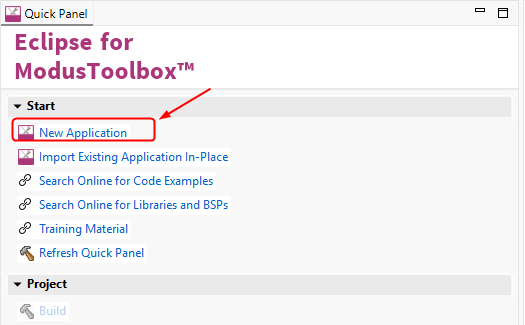
The New Application Wizard will guide you through the process of selecting a development board, choosing an application template, assigning a project name, and creating a project.
Step 2: Select a Development Board
The wizard will display a list of available Board Support Packages (BSPs).
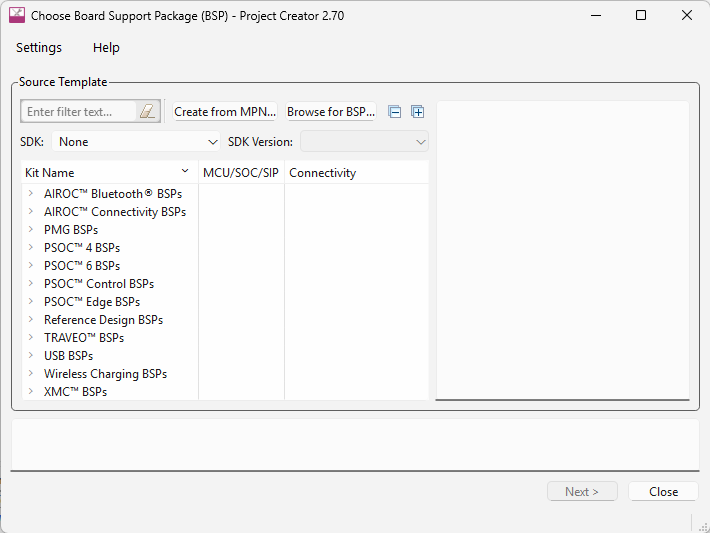
Select the BSP that matches your development board.
Example:
PSoC 6 BSPs
└── CY8CKIT-062S2-AI
└── CY8CKIT-062-WIFI-BT
└── CY8CPROTO-063-BLE
A Board Support Package (BSP) contains all hardware-specific information required by your application, including:
- Device definitions
- Startup code
- Peripheral drivers and support libraries
- Board-specific pin assignments
- Clock and hardware configuration settings
Important: Always select the BSP that matches the physical development board you are using. Choosing the wrong BSP may result in compilation errors or incorrect hardware operation.
After selecting the desired BSP, click Next.
Step 3: Select an Application Template
ModusToolbox provides numerous application templates that demonstrate various hardware features, middleware components, and software frameworks.
Common template categories include:
- Empty Applications
- GPIO Examples
- UART Communication Examples
- Bluetooth LE Examples
- Wi-Fi Examples
- FreeRTOS Examples
- Machine Learning and AI Examples
These templates provide preconfigured source code and project settings, allowing developers to quickly evaluate hardware features and begin application development.
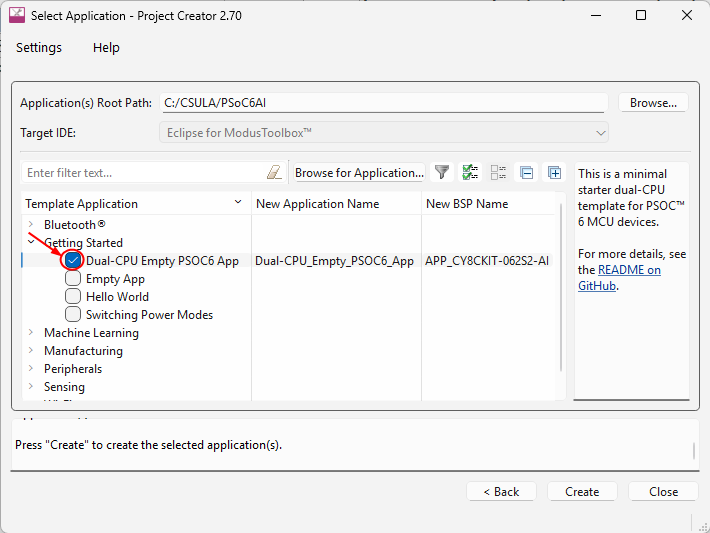
If you are unsure which template to select, choose:
Getting Started
└── Dual-CPU Empty PSOC6 App
The ☐ Dual-CPU Empty PSOC6 App template is recommended for beginners because it provides:
- A clean and minimal project structure
- Support for both PSoC 6 processor cores
- No unnecessary middleware components
- A flexible starting point for laboratory exercises and custom applications
For most classroom assignments and embedded system projects, this template is an excellent starting point.
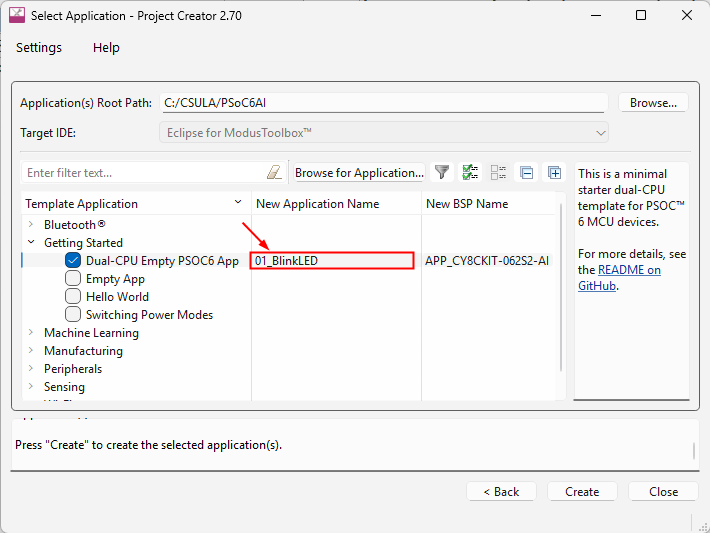
Step 4: Assign an Application Name
Enter a meaningful name for your project.
Application names should be:
- Short and descriptive
- Related to the application function
- Free of spaces and special characters
Examples:
- 01_BlinkLED
- 02_GPIO_InputOutput
- 03_UART_Terminal
- 04_PWM_LED_Dimmer
- 05_AI_AudioRecognition
The project will be created inside your selected workspace folder.
After selecting the desired template, click Next.
Step 5: Create the Application
After selecting the BSP and application template, click the Create button.
ModusToolbox will automatically:
- Generate the project structure
- Create source and configuration files
- Download any required BSP packages
- Install required middleware components
- Configure the build environment
Depending on your network connection speed and the selected components, this process may take several minutes.
A progress window will be displayed while ModusToolbox downloads and installs the required files.
Note: The first project creation process typically takes longer because ModusToolbox may need to download additional device support files, middleware libraries, and development tools.
Once the process is complete, the project will appear in the Project Explorer window and will be ready for development.
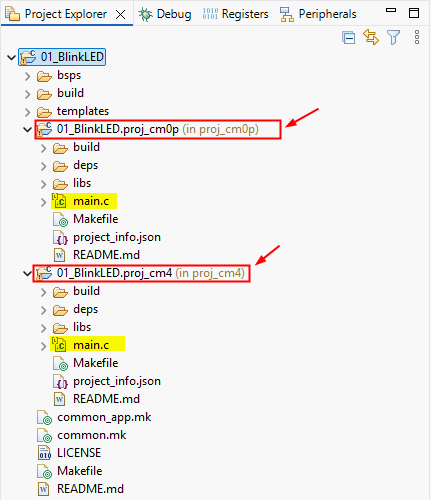
Step 6: Verify the Project Structure
After the project has been created successfully, verify that it appears in the Project Explorer window.
For the Dual-CPU Empty PSOC6 App template, you will typically see separate source code folders for the two processor cores:
- CM0+ Core (Cortex-M0+)
- CM4 Core (Cortex-M4)
In most applications:
- The CM0+ core handles system initialization, power management, and supporting tasks.
The CM4 core executes the main application code and performs most user-defined processing.
For beginner laboratory exercises, students will typically work primarily with the CM4 core source files.
The project is now ready to be compiled, programmed, and debugged.
2.4 Configuring Peripheral Devices
The PSoC 6 family features a dual-core architecture, consisting of two processor cores:
- CM0+ Core (Arm Cortex-M0+)
- CM4 Core (Arm Cortex-M4)
Each processor core executes its own program and therefore has its own main() function. In a typical PSoC 6 application:
- The CM0+ core is primarily responsible for system startup, power management, and enabling the CM4 core.
- The CM4 core executes the main application and performs most user-defined tasks.
For most laboratory exercises and embedded applications, students will primarily develop software for the CM4 core.
1. Structure of the main() Function
Although the CM0+ and CM4 applications have different responsibilities, both follow a similar program structure:
int main(void)
{
    // System and peripheral initialization

    for (;;) {
        // Main application code
    }
}
The processor executes statements sequentially from top to bottom. Once execution enters the infinite loop:
for (;;) {

}
The processor repeatedly executes the code inside the loop and normally never exits unless the device is reset or powered off.
As a result, all required initialization tasks must be completed before entering the infinite loop.
2. Why Peripheral Initialization Must Occur Before the Infinite Loop
Peripheral devices such as GPIO, UART, I²C, SPI, PWM, and ADC require initialization before they can be used.
Initialization typically includes:
- Configuring pin assignments
- Setting communication parameters
- Enabling clocks
- Configuring interrupts
- Setting operating modes
If a peripheral is used before it has been initialized, the hardware may behave unexpectedly or fail to operate correctly.
Important: Peripheral initialization code must always be executed before entering the infinite loop.
3. Adding Peripheral Initialization Code
When creating an application, users typically add peripheral initialization code immediately before the infinite loop.
The general program structure is shown below:
int main(void)
{
    // Initialize board and device
    cybsp_init();

    // Enable interrupts
    __enable_irq();

    // Initialize peripherals
    initialize_GPIO();
    initialize_UART();
    initialize_PWM();

    // Main application loop
    for (;;) {
        // Application code
    }
}
Examples of peripheral initialization include:
- Configuring an LED as a GPIO output
- Configuring a push button as a GPIO input
- Initializing a UART interface for serial communication
- Setting up PWM for motor control or LED dimming
- Configuring an ADC to read analog sensors
Once the peripherals have been initialized, they can be safely accessed inside the infinite loop.
4. Correct and Incorrect Examples
Correct Example:
int main(void)
{
    initialize_GPIO();

    for (;;) {
        toggle_LED();
    }
}
In this example, the GPIO peripheral is initialized before it is used. This ensures that the pin direction, drive mode, and related hardware settings are properly configured before the application attempts to control the LED.
Incorrect Example:
int main(void)
{
    for (;;) {
        toggle_LED();
    }
    initialize_GPIO();  // Never executed
}
This example contains two major problems.
First, the initialize_GPIO() function is placed after the infinite loop. Since the processor remains inside the for (;;) loop indefinitely, any code written after the loop is normally unreachable and will never be executed.
Second, the program attempts to call toggle_LED() before the GPIO peripheral has been initialized. If a peripheral is accessed before it is properly configured, the system may operate incorrectly. In some cases, this may trigger a fault exception, such as a hardware-related fault or system fault. When this occurs, the processor may stop normal program execution, enter a fault handler, or appear to become unresponsive.
Warning: Always initialize peripheral devices before using them in the application code. Uninitialized peripherals may cause unpredictable behavior, fault exceptions, or system lockup.
2.5 Implementing Application Logic
After the system and peripheral initialization are complete, the application's runtime code should run in an infinite loop.
In embedded systems, the processor is expected to run continuously throughout the device's lifetime. Therefore, the application logic for each processor core should be placed within its corresponding infinite loop.
A typical program structure is shown below:
int main(void) {
    // System initialization
    initialize_system();

    // Peripheral initialization
    initialize_peripherals();

    //Main application loop
    for (;;) {
        // Application logic

    }
}
The statement
for (;;) {
}
creates an infinite loop, causing the processor to repeatedly execute the application code indefinitely.
1. Why Is an Infinite Loop Required?
Unlike desktop applications, embedded systems are designed to operate continuously after power is applied. The processor repeatedly performs tasks and responds to external events until the system is powered off or reset.
Examples of application logic include:
- Reading buttons or switches
- Updating LEDs or displays
- Receiving UART data
- Reading sensors
- Processing communication packets
- Performing AI inference
- Controlling motors or actuators
- Handling wireless communication
These tasks are typically executed repeatedly inside the infinite loop.
2. Example of Application Logic
The following example continuously toggles an LED:
int main(void)
{
    initialize_GPIO();

    for (;;) {
        toggle_LED();
        DelayMs(500);
    }
}
Because the loop runs forever, the LED toggles continuously as long as the system remains powered.
3. Do Not Exit the main() Function
In embedded systems, the processor should never exit the main() function.
The main() function serves as the entry point of the application. Once execution reaches the end of main(), the processor no longer has valid application code to execute. Depending on the system configuration, this may result in:
- Unpredictable behavior
- Program crashes
- Fault exceptions
- System lockup or reset
- The device is becoming unresponsive
For this reason, every processor core should remain inside an infinite loop for the entire duration of system operation.
Important: Ensure that the processor never exits the main() function. All application logic should be implemented within the infinite loop of the corresponding processor core.
2.6 Compiling the Project
After creating a project and implementing the application logic, the next step is to compile the source code into executable firmware that can be programmed into the PSoC 6 MCU.
ModusToolbox provides project management and build tools through the Project Explorer and Quick Panel windows.
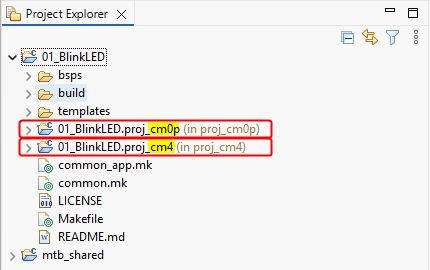
1. Understanding the Project Structure
When using the Dual-CPU Empty PSOC6 App template, the project structure typically appears as follows:
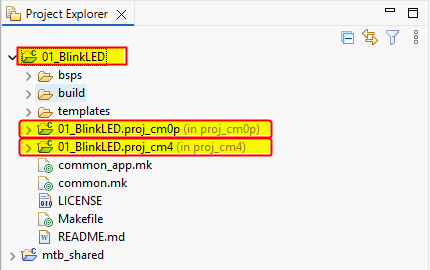
Where:
- 01_BlinkLED – The complete multi-core application
- 01_BlinkLED.proj_cm0p – The CM0+ core project
- 01_BlinkLED.proj_cm4 – The CM4 core project
The PSoC 6 MCU contains two processor cores:
- CM0+ Core (Arm Cortex-M0+)
- CM4 Core (Arm Cortex-M4)
Each processor core has its own source code, linker script, and executable image.
The Quick Panel dynamically updates its available launch options based on the item selected in the Project Explorer.
Important: In most laboratory exercises, you should select the top-level project folder (e.g., 01_BlinkLED) rather than the individual core projects.
2. Compiling the Project
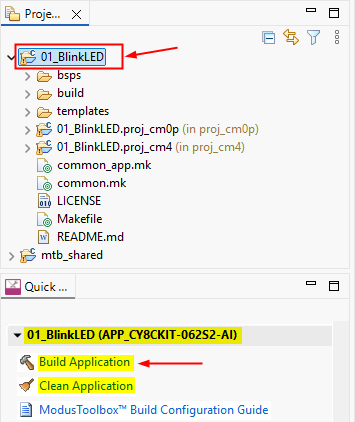
To compile the entire application:
- Select the top-level project folder (e.g., 01_BlinkLED) in the Project Explorer.
- In the Quick Panel, click
 Build Application.
ModusToolbox will automatically:
- Compile the CM0+ source code
- Compile the CM4 source code
- Link both applications
- Generate executable files
- Create firmware images for programming
Build messages, warnings, and errors are displayed in the Console window.
If the build is successful, the generated firmware is ready to be programmed into the PSoC 6 MCU.
Recommendation: For most projects, compile the top-level project so that both processor cores are built together.
3. Compiling Individual Core Projects
You may also compile individual core projects by selecting: 01_BlinkLED.proj_cm0p or 01_BlinkLED.proj_cm4, and then selecting ![]() Build Project from the Quick Panel.
Build Project from the Quick Panel.
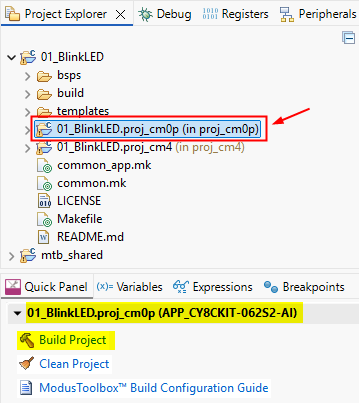
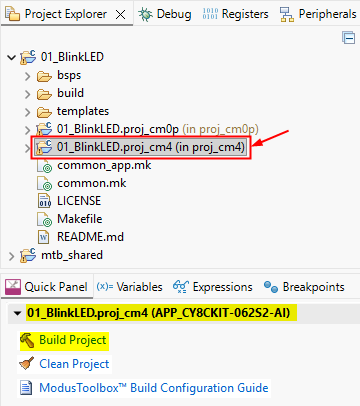
Compiling an individual core project builds only that processor's firmware. For example:
- Building 01_BlinkLED.proj_cm0p compiles only the CM0+ application.
- Building 01_BlinkLED.proj_cm4 compiles only the CM4 application.
Project Build vs. Individual Core Build
The following table summarizes the differences:
| Selected Item | Compiled Components | Recommended For |
| 01_BlinkLED | CM0+ and CM4 | General development |
| 01_BlinkLED.proj_cm0p | CM0+ only | Advanced debugging |
| 01_BlinkLED.proj_cm4 | CM4 only | Advanced debugging |
Compiling the top-level project ensures that both cores remain synchronized and compatible.
Compiling an individual core may be useful when:
- Debugging a specific processor core
- Reducing build time during advanced development
- Testing modifications that affect only one core
However, building only one core may result in mismatched firmware versions if changes were made to both applications.
4. When Should You Use Clean Project?
The Clean Project command removes previously generated build files and forces ModusToolbox to rebuild the entire project from scratch.
Use Clean Project when:
- You changed project settings or build configurations.
- You modified BSP or middleware components.
- You added or removed source files.
- The project produces unexpected build errors.
- The firmware behaves unexpectedly after significant modifications.
- You want to ensure that all files are rebuilt from a clean state.
For routine code changes, a normal Build operation is usually sufficient.
Recommendation: Use Clean Project only when necessary, since a full rebuild takes longer than a normal build.
2.7 Programming the Project
After successfully compiling a project, the next step is to program the generated firmware into the PSoC 6 MCU. ModusToolbox provides several programming options through the Launches section of the Quick Panel window.
The available programming functions depend on which project is selected in the Project Explorer window.
1. Understanding the Launches Section
The Launches section of the Quick Panel dynamically updates based on the currently selected project.
For example, consider the following project structure:
01_BlinkLED
├── 01_BlinkLED.proj_cm0p
└── 01_BlinkLED.proj_cm4
When different projects are selected, ModusToolbox displays different programming options.
Selecting the Top-Level Project
Selecting the Top-Level Project
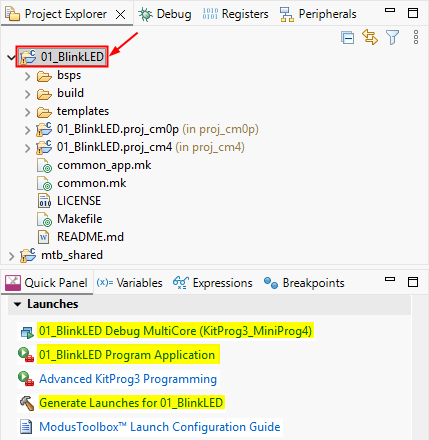
When the top-level project is selected 01_BlinkLED, the Launches section typically displays:
- 01_BlinkLED Debug MultiCore (KitProg3_MiniProg4)
- 01_BlinkLED Program Application
- Generate Launches for 01_BlinkLED
The top-level project represents the complete multi-core application containing both the CM0+ and CM4 processor cores.
Selecting the CM0+ Project
Selecting the CM0+ Project
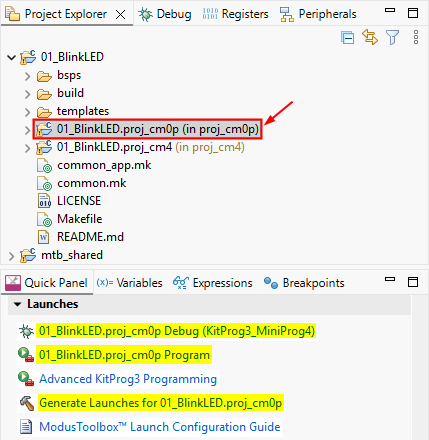
When the CM0+ project is selected 01_BlinkLED.proj_cm0p, the Launches section typically displays:
- 01_BlinkLED.proj_cm0p Debug (KitProg3_MiniProg4)
- 01_BlinkLED.proj_cm0p Program Application
- Generate Launches for 01_BlinkLED.proj_cm0p
Selecting the CM4 Project
Selecting the CM4 Project
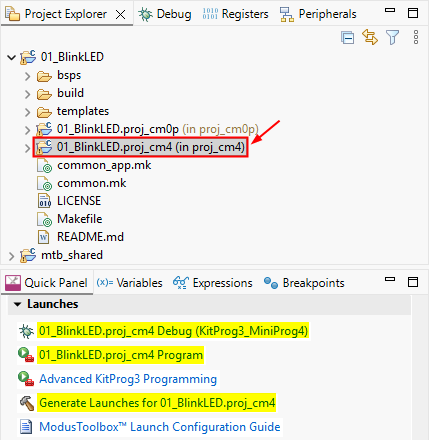
When the CM4 project is selected 01_BlinkLED.proj_cm4, the Launches section typically displays:
- 01_BlinkLED.proj_cm4 Debug (KitProg3_MiniProg4)
- 01_BlinkLED.proj_cm4 Program Application
- Generate Launches for 01_BlinkLED.proj_cm4
2. Programming the Entire Application
For most applications and laboratory exercises, users should select the top-level project: 01_BlinkLED, and then click 01_BlinkLED Program Application
This option automatically programs both processor cores into the PSoC 6 MCU:
- CM0+ firmware
- CM4 firmware
After programming is complete:
- The MCU resets.
- The CM0+ core starts executing.
- The CM0+ core enables the CM4 core.
- The complete application begins running.
Recommendation: For beginners and laboratory exercises, always use the Program Application from the top-level project.
3. When Should You Use the Program Application?
Use 01_BlinkLED Program Application for the following situations:
- GPIO applications
- UART applications
- PWM applications
- ADC applications
- Bluetooth LE applications
- Wi-Fi applications
- AI and Machine Learning applications
- General embedded system projects
In practice, this is the programming option used in most PSoC 6 projects.
4. Programming Individual Processor Cores
ModusToolbox also allows users to program individual processor cores.
Examples include:
- 01_BlinkLED.proj_cm0p Program Application
and
- 01_BlinkLED.proj_cm4 Program Application
These options program only the selected processor core.
For example:
- proj_cm0p Program Application programs only the CM0+ firmware.
- proj_cm4 Program Application programs only the CM4 firmware.
5. When Should You Use Single-Core Programming?
Single-core programming is intended primarily for advanced users and specialized applications.
Typical use cases include:
- Bootloader development
- Firmware update systems
- Testing only one processor core
- Advanced multi-core development
- Special deployment workflows
In normal applications, programming only one core may result in firmware version mismatches between the CM0+ and CM4 applications.
For example:
- CM0+ : Version 1.0
- CM4 : Version 2.0
This mismatch may lead to:
- Inter-processor communication (IPC) errors
- Startup failures
- Unexpected system behavior
Warning: Unless you fully understand the dual-core architecture, avoid programming on a single processor core.
6. Connecting the Development Board
Before programming the device:
- Connect the development board to the computer using the KitProg3 USB port.
- Ensure that the board is powered on.
- Verify that the operating system detects the KitProg3 programmer.
If multiple development boards are connected, verify that the correct board is selected.
7. Advanced KitProg3 Programming
ModusToolbox provides an Advanced KitProg3 Programming option for specialized programming tasks.
Use this feature when:
- Recovering a device that cannot be programmed normally
- Erasing device memory manually
- Working with multiple connected boards
- Performing advanced programming operations
- Using custom programming settings
Most users and laboratory exercises do not require this feature.
Recommendation: Use Advanced KitProg3 Programming only when the standard programming process fails or when instructed to do so.
8. Summary
When programming PSoC 6 applications:
- The top-level project programs both CM0+ and CM4.
- Individual core programs use only one processor core.
- Most users should use the Program Application from the top-level project.
- Single-core programming is intended for advanced applications.
- Use Advanced KitProg3 Programming only when necessary.
2.8 Debugging the Project
After programming the firmware into the PSoC 6 MCU, developers often need to verify program behavior and diagnose software issues. ModusToolbox provides powerful debugging tools that allow users to observe and control program execution in real time.
Debugging is an essential part of embedded systems development because it helps developers identify and correct software errors.
1. Introduction to Debugging
Debugging is the process of observing and controlling program execution to identify and correct software errors.
Unlike programming, which simply transfers firmware to the MCU, debugging allows developers to interact with the running application.
During a debug session, users can:
- Pause program execution
- Step through the code line by line
- Inspect variables and registers
- Monitor memory contents
- Analyze program flow
- Identify software bugs
Debugging is particularly useful when the program compiles successfully but does not behave as expected.
2. Understanding the Debug Launches
The debugging functions are located in the Launches section of the Quick Panel window.
The available launch options depend on which project is selected in the Project Explorer.
Consider the following project structure:
01_BlinkLED
├── 01_BlinkLED.proj_cm0p
└── 01_BlinkLED.proj_cm4
Top-Level Project
Top-Level Project
When the top-level project is selected 01_BlinkLED, the Launches section typically displays:
- 01_BlinkLED Debug MultiCore (KitProg3_MiniProg4)
- 01_BlinkLED Program Application
CM0+ Project
CM0+ Project
When the CM0+ project is selected 01_BlinkLED.proj_cm0p, the Launches section typically displays:
- 01_BlinkLED.proj_cm0p Debug (KitProg3_MiniProg4)
- 01_BlinkLED.proj_cm0p Program Application
CM4 Project
CM4 Project
When the CM4 project is selected 01_BlinkLED.proj_cm4, the Launches section typically displays:
- 01_BlinkLED.proj_cm4 Debug (KitProg3_MiniProg4)
- 01_BlinkLED.proj_cm4 Program Application
3. Multi-Core Debugging
To debug the complete application, select the top-level project 01_BlinkLED and click 01_BlinkLED Debug MultiCore (KitProg3_MiniProg4).
This option starts a multi-core debug session, allowing both processor cores to be debugged simultaneously:
- CM0+ Core (Cortex-M0+)
- CM4 Core (Cortex-M4)
Multi-core debugging is recommended for:
- General application debugging
- Inter-Processor Communication (IPC)
- Shared memory applications
- Power management debugging
- Deep Sleep troubleshooting
- Synchronization between processor cores
Recommendation: For beginners and laboratory exercises, always use Multi-Core Debug whenever possible.
4. Single-Core Debugging
ModusToolbox also supports debugging individual processor cores.
CM0+ Debugging
CM0+ Debugging
Select 01_BlinkLED.proj_cm0p and click 01_BlinkLED.proj_cm0p Debug (KitProg3_MiniProg4). This mode debugs only the CM0+ core.
Typical use cases include:
- System startup debugging
- Clock configuration
- Power management
- Deep Sleep issues
- Inter-Processor Communication (IPC)
- Enabling the CM4 core
Most beginners rarely need to debug the CM0+ core directly.
CM4 Debugging
CM4 Debugging
Select 01_BlinkLED.proj_cm4 and click 01_BlinkLED.proj_cm4 Debug (KitProg3_MiniProg4). This mode debugs only the CM4 core.
Typical use cases include:
- GPIO applications
- UART communication
- PWM control
- ADC applications
- Bluetooth LE applications
- AI and Machine Learning applications
Since most application code is implemented on the CM4 core, this is the most commonly used single-core debugging mode.
5. Starting a Debug Session
To start a debug session:
- Connect the development board using the KitProg3 USB port.
- Build the project successfully.
- Select the desired project in the Project Explorer.
- Click the appropriate Debug option in the Launches section.
- Wait for ModusToolbox to program the device and launch the debugger.
ModusToolbox may automatically switch to the Debug Perspective.
The Debug Perspective typically contains:
- Debug View
- Variables View
- Registers View
- Console View
- Project Explorer
Debug Windows in ModusToolbox
During a debug session, ModusToolbox provides several views that allow developers to monitor program execution, inspect hardware registers, and analyze peripheral states. Understanding these debug windows is essential for efficient debugging of embedded systems.
Debug View
Debug View
The Debug View displays the current debug sessions and the execution state of each processor core.
Typical information displayed includes:
- Active debug sessions
- Processor cores being debugged (CM0+ and CM4)
- Current thread status
- Call stack information
- Current execution location
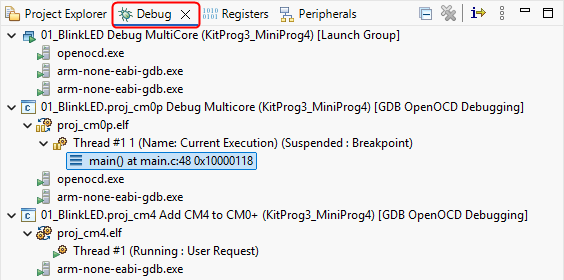
In the example shown in Figure XX, the CM0+ core is suspended at a breakpoint:
- Thread #1 (Suspended: Breakpoint)
- main() at main.c:48
while the CM4 core is still running:
- Thread #1 (Running: User Request)
The Debug View is particularly useful for:
- Determining whether the processor is running or paused
- Switching between CM0+ and CM4 debug sessions
- Viewing the call stack
- Terminating the debug session
Tip: Double-clicking a stack frame (![]() main() at main.c:48) automatically opens the corresponding source file and navigates to the current line of execution.
main() at main.c:48) automatically opens the corresponding source file and navigates to the current line of execution.
Registers View
Registers View
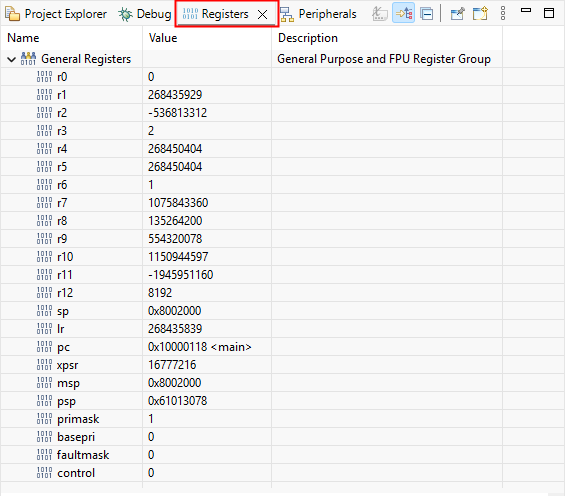
The Registers View displays the current values of the CPU registers.
These registers represent the processor's internal state and are useful for low-level debugging.
Common registers include:
| Register | Description |
| R0–R12 | General-purpose registers |
| SP | Stack Pointer – points to the top of the stack |
| LR | Link Register – stores the return address of function calls |
| PC | Program Counter – store the address of the next instruction to execute |
| xPSR | Program Status Register |
| MSP | Main Stack Pointer – points to the main stack used by the processor. |
| PSP | Process Stack Pointer – points to an alternate stack used by application threads or tasks. |
| PRIMASK | Interrupt mask register |
| BASEPRI | Base Priority Mask Register – defines the minimum interrupt priority level that can execute. |
| FAULASK | A special register that controls fault handling. When set to 1, it disables all exceptions except the Non-Maskable Interrupt (NMI). |
| CONTROL | Controls the processor's operating mode and stack selection. It determines whether the processor runs in privileged or unprivileged mode and whether it uses the MSP or PSP as the current stack pointer. |
For example:
- PC = 0x10000118 <main>
indicates that the processor is currently executing the main() function.
The Registers View is useful for:
- Low-level debugging
- Investigating faults and exceptions
- Examining processor state
- Debugging assembly code
Advanced Note: When a HardFault occurs, the register values often help identify the source of the error.
Peripherals View
Peripherals View
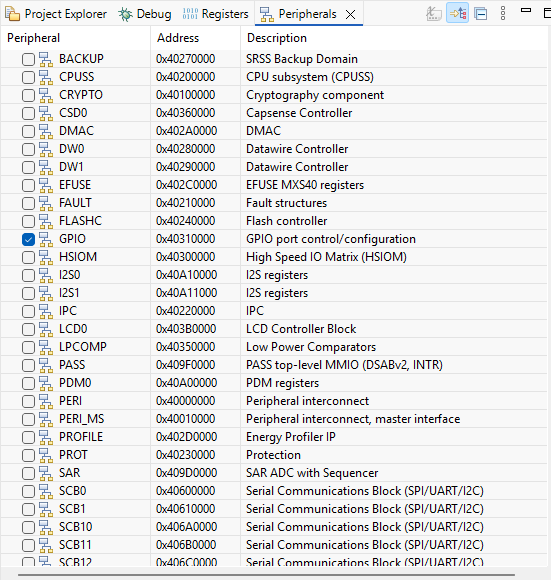
The Peripherals View provides access to the memory-mapped registers of on-chip peripherals.
Examples of peripherals include:
- GPIO
- UART (SCB)
- ADC (SAR)
- DMA
- IPC
- Clock control
- Flash controller
Each peripheral can be expanded to display its registers and current values.
The Peripherals View allows developers to:
- Observe hardware behavior in real time
- Verify peripheral configuration
- Debug hardware-related issues
Tip: Register values are updated automatically while debugging.
GPIO View
When GPIO is selected in the Peripherals View, the GPIO View displays the registers associated with the selected GPIO port.
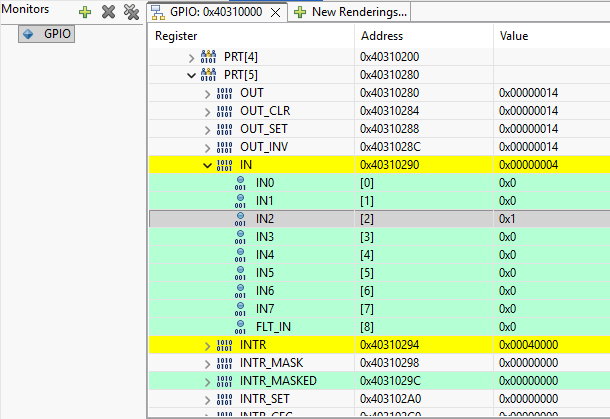
For example:
GPIO
└── PRT[5]
├── OUT
├── OUT_SET
├── OUT_CLR
├── IN
└── INTR
Common GPIO registers include:
| Register | Description |
| OUT | Current output value of the GPIO pins |
| OUT_SET | Sets output bits |
| OUT_CLR | Clears output bits |
| OUT_INV | Toggles output bits |
| IN | Reads input pin states |
| INTR | Interrupt status register |
In the example:
- IN = 0x00000004
Bit 2 is high, indicating that GPIO pin 2 is currently receiving a logic HIGH signal.
The GPIO View is useful for:
- Verifying push-button inputs
- Monitoring LED outputs
- Debugging the GPIO configuration
- Checking interrupt status
Variables View
Variables View
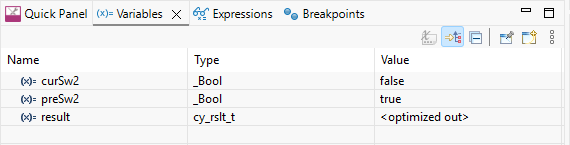
The Variables View displays the values of local and global variables while the processor is paused.
Example:
- bool curSw2 = false;
- bool preSw2 = true;
The Variables View shows:
- Variable names
- Data types
- Current values
This window is particularly useful for:
- Verifying program logic
- Observing state transitions
- Monitoring sensor values
- Checking flags and counters
Note: Variables optimized by the compiler may appear as:
<optimized out>
To improve debugging visibility, consider compiling in Debug mode or reducing compiler optimization levels.
Expressions View
Expressions View
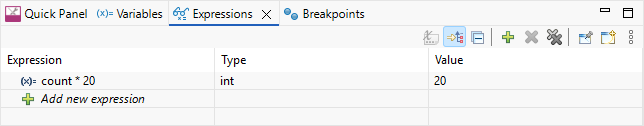
The Expressions View allows users to monitor custom variables and expressions during debugging.
Users can manually add expressions such as:
- temperature
- counter * 2
- sensor_data[0]
Unlike the Variables View, which only displays variables in the current scope, the Expressions View can track user-selected variables throughout the debug session.
The Expressions View is useful for:
- Monitoring frequently used variables
- Evaluating expressions in real time
- Tracking system states
Breakpoints View
Breakpoints View
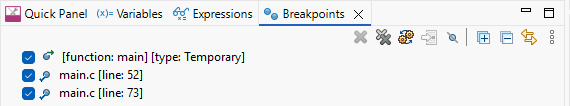
The Breakpoints View displays all breakpoints currently defined in the project.
Each breakpoint entry typically includes:
- Source file
- Line number
- Enable/disable status
Example:
- main.c [line: 52]
- main.c [line: 73]
The Breakpoints View allows users to:
- Enable or disable breakpoints
- Remove breakpoints
- Jump directly to source code locations
- Manage multiple breakpoints in large projects
Breakpoints are one of the most powerful debugging tools because they allow developers to pause execution precisely at points of interest.
Tip: Excessive breakpoints may slow down debugging. Use them strategically to isolate software issues.
6. Using Breakpoints
A breakpoint temporarily stops program execution at a specific line of code.
Example:
![]()
When execution reaches this line:
- The processor pauses.
- Variables can be inspected.
- Memory and registers can be examined.
To set a breakpoint:
- Open the source file.
- Double-click the left margin next to the desired line number.
A blue dot ![]() typically indicates a breakpoint.
typically indicates a breakpoint.
7. Debug Controls
![]()
During debugging, the toolbar provides several execution controls:
| Button | Function |
| Continue program execution | |
| Pause execution | |
| End the debug session | |
| Disconnects the debugger from the MCU while allowing the MCU to continue running. | |
| Enter a function call | |
| Execute the current line without entering functions | |
| Finish the current function and return |
These controls allow developers to analyze program behavior step by step.
8. Ending a Debug Session
When debugging is complete:
- Click
 Terminate to stop the debugger.
 - Wait for the debug session to close completely.
Recommendation: Always terminate the debug session properly before disconnecting the USB cable or powering off the board.
9. Common Debugging Issues
Cannot Connect to KitProg3
Possible solutions:
- Check the USB cable.
- Try a different USB port.
- Reconnect the development board.
- Verify that the KitProg3 driver is installed correctly.
Program Stops at HardFault_Handler()
This error may be caused by:
- Null pointer access
- Invalid memory access
- Stack overflow
- Using an uninitialized peripheral
- Array index out of bounds
CM4 Does Not Start
Verify that the CM0+ application contains:
Cy_SysEnableCM4(CY_CORTEX_M4_APPL_ADDR);
Without this function call, the CM4 core will never begin execution.
10. Summary
When debugging PSoC 6 applications:
- Multi-Core Debug is recommended for most applications.
- Single-Core Debug is useful for advanced development.
- Breakpoints allow developers to pause execution.
- Variables, registers, and memory can be inspected in real time.
- Always terminate the debug session properly.
- Many system errors can be diagnosed using the debugger.
Debugging is an essential skill for embedded systems development and greatly simplifies diagnosing and correcting software issues.