Lab 05: Oscilloscope Operation
Objective
- To become familiar with using an oscilloscope and function generator.
- To measure phase angle using Lissajous polar.
Equipment
Background
Oscilloscope X-Y Mode
Oscilloscope
The oscilloscope is a device that displays a graph of voltage vs. time (voltage on the vertical axis, time on the horizontal axis). If the voltage is DC, that is, constant in time, then the oscilloscope display is a horizontal line whose vertical position indicates the voltage.
The oscilloscope screen has 1 cm divisions on both axes. There is a volts per division (volts/div) knob, which sets the vertical (volts) scale, and a seconds per division (sec/div) knob, which sets the horizontal (time) scale. There are knobs for setting the vertical and horizontal position of the display.
Under the volts/div knob is a 3-position switch that reads (AC - ground - DC).
- In the ground position, the input to the oscilloscope is grounded (set to 0 volts), and the display becomes a horizontal line whose position (which can be adjusted with the vertical position knob) is the zero volts position. For instance, one could set the middle line of the screen to be 0 volts. Then, positions above the middle would be positive voltages, and positions below the middle would be negative voltage.
- When the switch is in the DC position, the signal is input to the oscilloscope unaltered.
- When the switch is in the AC position, an internal capacitor is in series with the input to the oscilloscope, and the DC component of the signal is removed.
Lissajous Figures
Lissajous (pronounced "LEE-suh-zhoo") figure is a parametric plot of the harmonic system. Lissajous figures displayed on an oscilloscope can be used to give a quick estimate of the relative phase and the frequency of two signals.
X-Y Display Mode
Lissajous figures can be obtained with an oscilloscope, when it is operated in X-Y display mode. Using two input channels, the X-Y display mode converts the oscilloscope from a volts-versus-time display to a volts-versus-volts display. Channel 1 is the Y-axis input, and channel 2 is the X-axis input.
RC Low-Pass Filter
RC Low-Pass Filter
An RC low-pass filter allows signals with frequencies lower than a specific cutoff frequency to pass through while attenuating higher-frequency signals. It consists of a resistor (R) and a capacitor (C) connected in series. The output is typically taken across the capacitor.
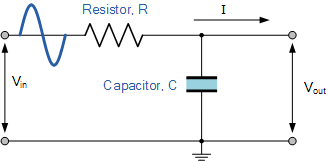
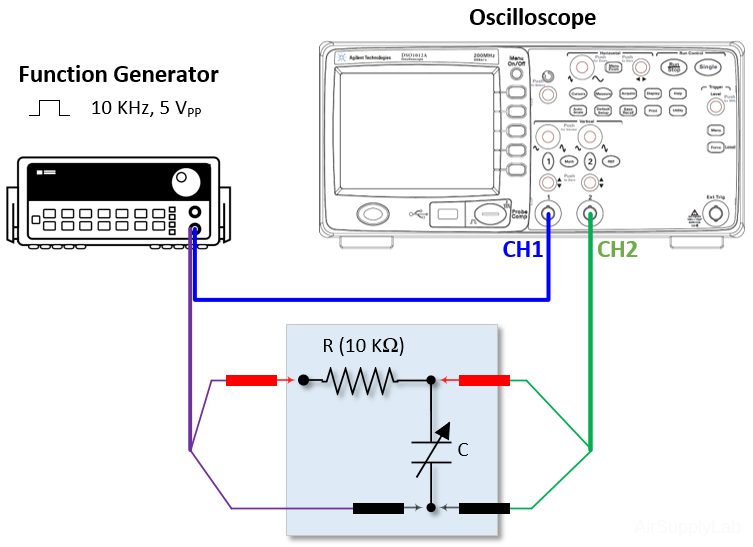
Figure 5-1: R-C Low-Pass Filter Circuit Diagram
Key Concepts
- Cutoff Frequency (fc): The frequency at which the output signal power drops to half its maximum value (−3 dB point). It determines the boundary between the passband and the stopband.
$${f_c} = {1 \over {2\pi RC}}$$ - Angular Frequency (ω): Related to the frequency by $\omega = 2\pi f$
- Phase Angle (ϕ): The phase difference between the input and output signals, measured in degrees or radians.
Calculating the Phase Angle
The phase angle in an RC low-pass filter indicates how much the output signal lags behind the input signal. It's calculated using the arctangent function based on the relationship between the resistor and capacitor.
Formula: $\phi = - {\tan ^{ - 1}}(\omega RC)$
Where:
- 𝜙 = Phase angle (in degrees or radians)
- 𝜔 = Angular frequency (2𝜋𝑓)
- 𝑅 = Resistance (in ohms, Ω)
- 𝐶 = Capacitance (in farads, F)
Convert the result from radians to degrees if necessary: ${\phi _{degree}} = {\phi _{radians}} \times ({{180} \over \pi })$
Note: The negative sign indicates that the output lags the input.
Example Calculation:
Given:
- R = 10 kΩ = 10,000 Ω
- 𝐶 = 100 nF = 100 × 10−9 𝐹
- 𝑓 = 1 kHz = 1,000 𝐻𝑧
Steps:
- Calculate ω:
$\omega = 2\pi f = 2\pi \times 1,000 \approx 6,283\,rad/s$ - Compute 𝜔𝑅𝐶:
$\omega RC = 6,283 \times 10,000 \times 100 \times {10^{ - 9}} = 6,283$ - Calculate ϕ:
$\phi = - {\tan ^{ - 1}}(6.283) \approx - 80.96^\circ $
Interpretation: At 1 kHz, the output voltage lags the input voltage by approximately 80.54 degrees.
Graphical Representation
The phase angle varies with frequency:
- At Low Frequencies ($f \ll {f_c}$): $\phi \approx 0^\circ $
The output is almost in phase with the input. - At High Frequencies ($f \gg {f_c}$): $\phi \approx - 90^\circ $
The output lags the input by nearly 90 degrees. - At Cutoff Frequency ($f = {f_c}$): $\phi \approx - 45^\circ $
The output lags the input by 45 degrees.
Calculate The Phase Angle of an R-C Low-Pass Filter on the Oscilloscope
To calculate the phase angle (φ) of an R-C low-pass filter, you can follow these steps:
- Measure the Time Difference: Use an oscilloscope to observe the input and output signals. Measure the input and output waveforms' time difference (Δ𝑡) between corresponding points (e.g., peaks or zero-crossings).
- Calculate the Phase Angle (Phase Shift): Use the formula
$\phi = {{\Delta t} \over T} \times 360^\circ $
where 𝑇 is the period of the input signal. - Alternative Formula: If you know the values of the resistor 𝑅 and capacitor 𝐶, and the input signal frequency 𝑓, you can use:
$\phi = - {\tan ^{ - 1}}({2\pi fRC})$
This provides the phase shift in radians, which can be converted to degrees by multiplying by 180/𝜋.
The phase angle in an RC low-pass filter is a crucial parameter that indicates how the filter affects the timing of the output signal relative to the input. By understanding and calculating this angle, you can design and analyze circuits to ensure they meet the desired performance specifications.
Rise Time vs Bandwidth
An RC low-pass filter's rise time and bandwidth are closely related. The key equation that links them is:
$$RiseTime({t_r}) \approx {{0.35} \over {Bandwidth(BW)}}$$
Explanation:
- Rise Time (tr): The time it takes for the signal to rise from 10% to 90% of its final value.
- Bandwidth (BW): The 3 dB frequency, the point where the signal's power drops to half (−3 dB) of its passband value.
The relationship means that as the bandwidth increases, the rise time decreases, allowing the system to respond more quickly to changes in input.
Example:
For a system with a rise time of 10 ns:
$$Bandwidth = {{0.35} \over {10 \times {{10}^{ - 9}}}} = 35 MHz$$
This means the system can effectively pass frequencies up to 35 MHz, but this bandwidth will limit the rise time.
To understand the relationship between the rise time of the pulse generator output, the observed rise time on the oscilloscope, and the oscilloscope’s ideal rise time, use the following formula:
$${t_{r,observed}} = \sqrt {t_{r.osc}^2 + t_{r,pulse}^2} $$
Where:
- 𝑡𝑟,observed: is the rise time displayed on the oscilloscope.
- 𝑡𝑟,osc: is the ideal rise time of the oscilloscope.
- 𝑡𝑟,pulse: is the actual rise time of the pulse generator output.
Step-by-Step Instructions:
- Measure the observed rise time on the oscilloscope (𝑡𝑟,observed).
- Determine the oscilloscope's rise time (𝑡𝑟,osc) from its bandwidth using the formula:
$${t_{r,osc}} \approx {{0.35} \over {B{W_{osc}}}}$$
(Where BWosc is the oscilloscope’s bandwidth). - Calculate the pulse generator’s rise time (𝑡𝑟,pulse) by rearranging the first equation:
$${t_{r,pulse}} = \sqrt {t_{r,observed}^2 - t_{r.osc}^2} $$
Practical Example:
- Observed rise time 𝑡𝑟,observed = 15 ns
- Oscilloscope’s rise time 𝑡𝑟,osc = 10 ns (derived from its bandwidth)
- Calculate:
$${t_{r,pulse}} = \sqrt {t_{r,observed}^2 - t_{r.osc}^2} = \sqrt {{{15}^2} - {{10}^2}} = \sqrt {125} \approx 11.18ns$$
This method ensures you account for the pulse generator and oscilloscope's contributions to the observed rise time.
Why is Rise Time and Bandwidth's Product 0.35?
This is how it works: A simple R-C circuit can derive the bandwidth and rise time relationship:
- The time constant will be $\tau = RC$. The bandwidth is $BW = \frac{1}{{2\pi \tau }} = \frac{1}{{2\pi RC}}$
Rise time is the time measured from Vout,90% - Vout,10%. The response for an RC network is Vout = Vin (1 – e-t/τ) - For Vout (t) = 0.1 Vin, we can get
$0.1{V_{in}} = {V_{in}}(1 - {e^{\frac{{ - {t_{10\% }}}}{\tau }}})$
where t10% is the time when the voltage reaches 10% of the final value. - After simplification:
$0.9 = {e^{\frac{{ - {t_{10\% }}}}{\tau }}}$
Applying the natural log to the above equation, we can get:
$\ln (0.9) = \frac{{ - {t_{10\% }}}}{\tau } \Rightarrow {t_{10\% }} = - \tau \times \ln (0.9)$
Similarly, for Vout(t) = 0.9 Vin, we can have
${t_{90\% }} = - \tau \times \ln (0.1)$ - The rise time is then:
${t_{RiseTime}} = {t_{90\% }} - {t_{10\% }} = \tau \times (\ln 0.9 - \ln 0.1) \simeq 2.2\tau \Rightarrow \tau = \frac{{{t_{RiseTime}}}}{{2.2}}$ - Substitute the above value of τ into the expression for bandwidth:
$BW = \frac{1}{{2\pi \tau }} = \frac{{2.2}}{{2\pi \times {t_{RiseTime}}}} = \frac{{0.35}}{{{t_{RiseTime}}}} \Rightarrow {t_{RiseTime}} \times BW = 0.35$
Procedure
Exp #1: X-Y Display
For this experiment, you need two function generators. So, it would help if you cooperated with a neighboring team to share their function generator.
Setup the connections
- On the oscilloscope, check the prob attenuation to "1X' on both channels. Set up the oscilloscope for an X-Y display mode and adjust the amplitude per division set to 1.00 V/Div on both channels (
 )
) - Connect the first function generator to the channel 1 input of the oscilloscope and the second to channel 2. Channel 1 will be displayed on the Y-axis, and channel 2 will be displayed on the X-axis.
- Set the frequency of the second function generator to 100 Hz, 0 V DC offset, and out voltage level to give a peak-to-peak voltage of 6 V. (Confirm the voltage value on the oscilloscope screen).
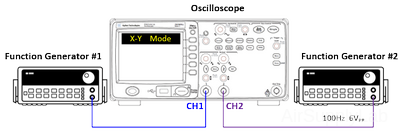
Figure 1: Two Function Generators and Oscilloscope
Exp 5-1: Display a Circle on the Oscilloscope Screen
- Adjust both Function Generators to produce a circle on the screen with a diameter of 6 V. Sketch and dimension the display and record the Function Generator settings
Table 1: Function Generator Setting for Exp 5-1 (Circle)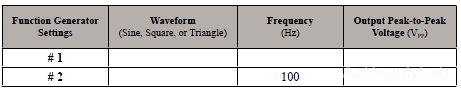

Figure 2: A Circle on the Screen
Exp 5-2: Display an Ellipse on the Oscilloscope Screen
- Adjust both Function Generators to produce an ellipse on the screen with a major axis (X-axis) of 6 V and a minor axis (Y-axis) of 2 V. Sketch, dimension the display, and record the Function Generator settings.
Table 2: Function Generator Setting for Exp 5-2 (Ellipse)
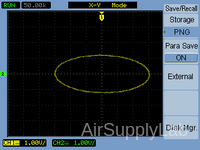
Figure 3: An Ellipse on the Screen
Exp 5-3: Display a Diamond-Shaped 1 on the Oscilloscope Screen
- Adjust both Function Generators to produce a diamond-shaped figure on the screen with a major axis (X-axis) of 6 V and a minor axis (Y-axis) of 6 V. Sketch, dimension the display, and record the Function Generator settings.
Table 3: Function Generator Setting for Exp 5-3 (Diamond-Shaped)
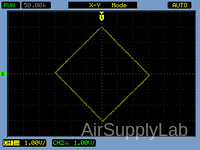
Figure 4: A Diamond-Shaped on the Screen
Exp 5-4: Display a Diamond-Shaped 2 on the Oscilloscope Screen
- Adjust both Function Generators to produce a diamond-shaped figure on the screen with a major axis (X-axis) of 6 V and a minor axis (Y-axis) of 2 V. Sketch, dimension the display, and record the Function Generator settings.
Table 4: Function Generator Setting for Exp 5-4 (Diamond-Shaped)

Figure 5: A Diamond-Shaped on the Screen
Exp 5-5: Display a Diamond-Shaped 3 on the Oscilloscope Screen
- Adjust both Function Generators to produce a diamond-shaped figure on the screen with a major axis (X-axis) of 2 V and a minor axis (Y-axis) of 6 V. Sketch, dimension the display, and record the Function Generator settings.
Table 5: Function Generator Setting for Exp 5-5 (Diamond-Shaped)
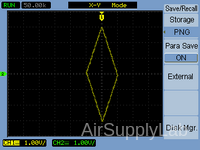
Figure 6: A Diamond-Shaped on the Screen
Exp 5-6: Display a Pattern of Dots on the Oscilloscope Screen
- Adjust both Function Generators to produce a pattern of dots on the screen with a spacing of 4 V between dots in both directions. Sketch, dimension the display, and record the Function Generator settings.
Table 6: Function Generator Setting for Exp 5-6 (Dots)
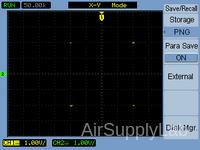
Figure 7: Dots on the Screen
Exp 5-7: Display "Figure 8" on the Oscilloscope Screen
- Adjust both Function Generators to produce a "figure 8" pattern on the screen with the "figure 8" being 6 V high and 4 V wide. Sketch, dimension the display, and record the function Generator settings.
Table 7: Function Generator Setting for Exp 5-6 (Figure 8)
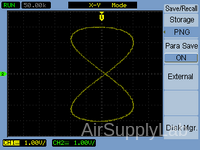
Figure 8: "Figure 8" on the Screen
Exp 5-8: Display "Figure ∞" on the Oscilloscope Screen
- Adjust both Function Generators to produce a "figure ∞" pattern on the screen with the "figure ∞" being 4 V high and 8 V wide. Sketch, dimension the display, and record the Function Generator settings.
Table 8: Function Generator Setting for Exp 5-6 (Figure ∞)
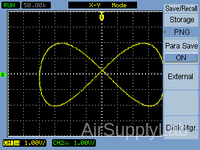
Figure 9: "Figure ∞" on the Screen
Exp #2: Oscilloscope Dual Channel Display
Setup the connection
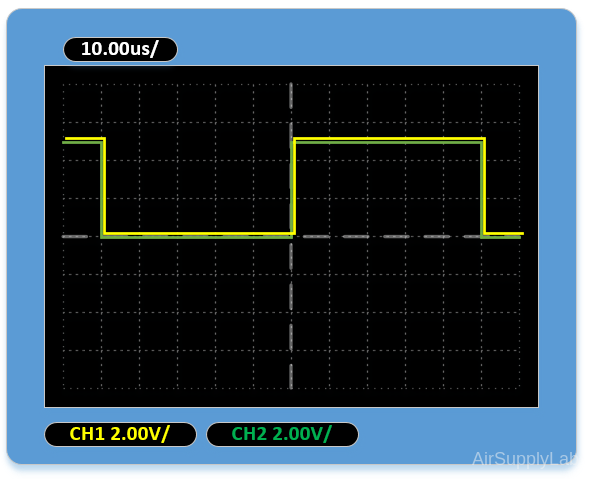
- Connect a Function Generator to the oscilloscope's CH 1 and CH 2 Input terminals. Set input coupling switches to DC for both channels. Set the Function Generator to give a SQUARE WAVE output voltage waveform with a peak-to-peak amplitude of 5 V and a frequency of 10 kHz. The oscilloscope sweep speed should be set to 10.00 μs/DIV. Adjust the vertical controls of both channels so that the two displays overlap precisely.
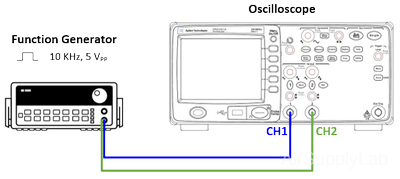
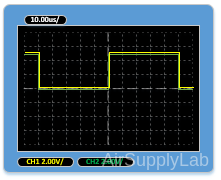
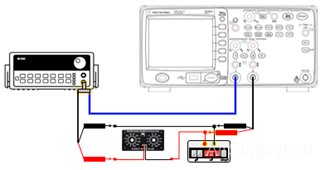
Figure 10: Connection
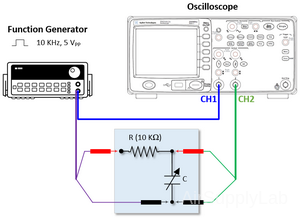
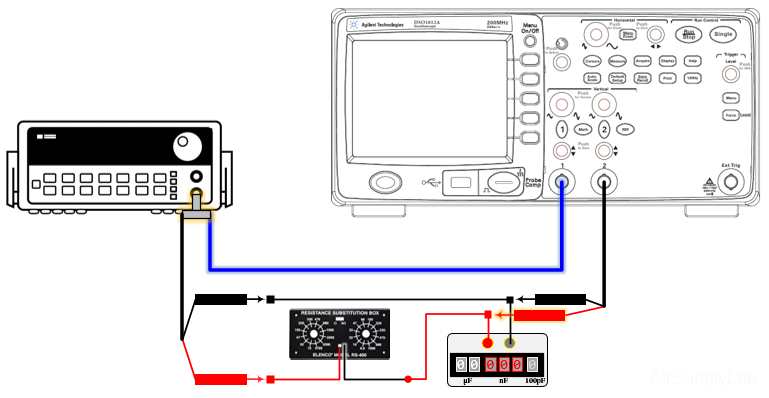
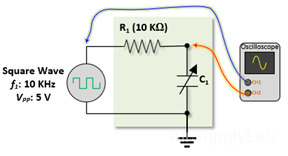
- Now insert an R-C low-pass network between the Function Generator and the CH 2 input of the oscilloscope. The RC network consists of a Resistance Substitution Box (R1) and a Decade Capacitor Box, Type CDA (C1), as shown in the diagram below. Start with the resistance set to 10 KΩ and the capacitance set to zero. The input voltage of the R-C network is displayed on CH 1, and the output voltage will be displayed on CH 2.
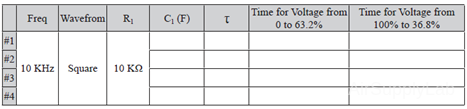
Exp 5-9: Calculate R-C Time Constant (τ)
Square Wave: 10 KHz, VPP: 5 V, R1: 10 KΩ, C1: Vary
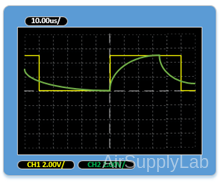
- Increase the capacitance and observe the results on the oscilloscope, then find the time it takes the output voltage to go from zero to 63.2% of the input voltage for four different capacitance values. Decrease the frequency as necessary to display the total transient response curve. Compare the zero to 63.2% rise time with the R-C time constant (i.e., the R-C product). Repeat this procedure for the 100% to 36.8% fall time.
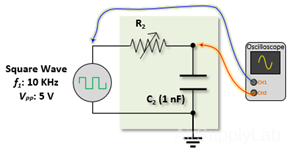
Exp 5-10: Calculate R-C Time Constant (τ)
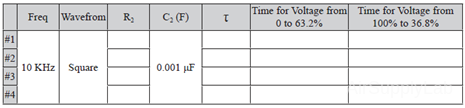
Square Wave: 10 KHz, VPP: 5 V, R2: Very, C2: 1 nF
- Set the resistance to zero and the capacitance to 1 nF (0.001 μF). Now, increase the resistance and observe the results on the oscilloscope. Decrease the frequency as necessary to display the total transient response curve, then find the time it takes the output voltage to go from zero to 63.2% of the input voltage for four different resistance values. Compare the zero to 63.2% rise time with the R-C time constant. Repeat this procedure for the 100% to 36.8% fall time.
Exp 5-11: Calculate R-C Time Constant (τ)
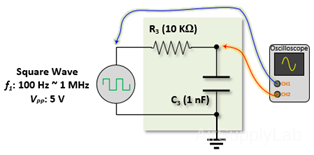
Square Wave: 100 Hz ~ 1 MHz, VPP: 5 V, R3: 10 KΩ, C3: 1 nF
- Set the resistance to 10 KΩ and the capacitance to 0.001 μF. Vary the frequency of the Function Generator from about 100 Hz to about 1 MHz and observe the results. Find the frequency at which the output voltage reaches only 10% of the input voltage. Under these conditions, the pulse width should be approximately 1/10 of the R-C time constant. Compare the time constant to the pulse width.
Exp 5-12: Calculate Phase Angle (ø)
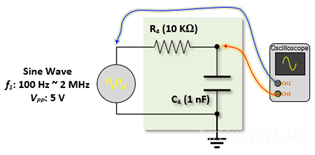
Sine Wave: 100 ~ 2 MHz, VPP: 5 V, R4: 10 KΩ, C4: 1 nF
- Set the Function Generator to produce a SINE WAVE output. Set R1 to 10 KΩ and C1 to 0.001 μF. Vary the frequency of the Function Generator from about 100 Hz up to about 2 MHz and compare the input and output waveforms.
- Find the frequency at which the output voltage has decreased to 70.71 % of the input voltage. Find the phase angle between the output and input waveforms at this frequency. Compare the frequency and phase angle with the expected values. Repeat this procedure for the frequency at which the output voltage has decreased to 50% of the input voltage and then for the frequency at which the output voltage is only 10%.
Questions
For most electronic systems, the relationship between the 3 dB bandwidth (BW) and the rise time (10% to 90%) is given approximately by RISE_TIME x BW =0.35.
Note: If a signal passes through several systems in series, (i.e. cascaded) the rise time at the output is given approximately as the square root of the sum of the squares of the rise times of the individual systems.
- An oscilloscope has a 35 MHz BW. Find the apparent rise time of the oscilloscope display if the signal input to the oscilloscope is an ideal pulse waveform.
- An oscilloscope has a 35 MHz BW. The oscilloscope is connected directly to a Pulse Generator, and the oscilloscope display shows a rise time of 15 ns. Find the rise time of the Pulse Generator output.
- A Pulse Generator produces a pulse waveform output with a 10 ns rise time. After the pulse signal has passed through some electronic system, it is displayed on the screen of a 35 MHz oscilloscope. The oscilloscope display shows a rise time of 25 ns. Find the rise time and the 3 dB BW of the electronic system.
- The input voltage of a system is displayed on CH 1 of an oscilloscope, and the output voltage is displayed on CH 2. Both waveforms are sinusoidal with a period of 1 ms. The CH 2 waveform lags behind the CH 1 waveform by 0.1 ms. Find the phase shift produced by the system under study. Express the answer in degrees and in radians.