Lesson 13: Advanced Graphics
Objectives
- To learn how MATLAB handles the image files.
- To learn how to create an animation.
Background
13.1 Images
Image Types
MATLAB can recognize three different techniques for storing and representing images:
- Indexed Images
- greyscale (Intensity) Images
- RGB (Truecolor) Images
Indexed Images
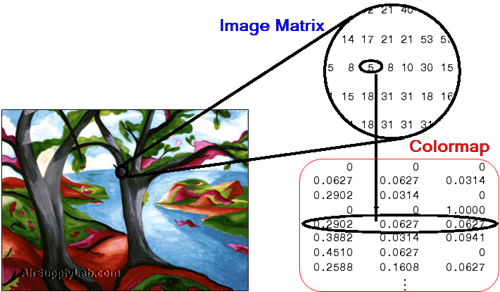
An indexed image consists of a data matrix, X, and a colormap matrix, map. map is an m×3 array of class double containing floating-point values in the range [0,1]. Each row of map specifies the red, green, and blue components of a single color. An indexed image uses "direct mapping" of pixel values to colormap values. The color of each image pixel is determined by using the corresponding value of X as an index into map. Values of X therefore must be integers. The value 1 points to the first row in map, the value 2 points to the second row, and so on. Display an indexed image with the statements
image(X); colormap(map)
A colormap is often stored with an indexed image and is automatically loaded with the image when you use the imread function. However, you are not limited to using the default colormap — use any colormap that you choose. The description for the property CDataMapping describes how to alter the type of mapping used.
The next figure illustrates the structure of an indexed image. The pixels in the image are represented by integers, which are pointers (indices) to color values stored in the colormap.
greyscale (Intensity) Images
A greyscale image, sometimes referred to as an intensity image, is a data matrix I whose values represent intensities within some range. A greyscale image is represented as a single matrix, with each element of the matrix corresponding to one image pixel. The matrix can be of class double, uint8, or uint16. While greyscale images are rarely saved with a colormap, a colormap is still used to display them. In essence, greyscale images are treated as indexed images.
This figure depicts a greyscale image of class double.

To display a greyscale image, use the imagesc ("image scale") function, which enables you to set the range of intensity values. imagesc scales the image data to use the full colormap. Use the two-input form of imagesc to display a greyscale image, for example:
imagesc(I,[0 1]); colormap(grey);
The second input argument to imagesc specifies the desired intensity range. The imagesc function displays I by mapping the first value in the range (usually 0) to the first colormap entry, and the second value (usually 1) to the last colormap entry. Values in between are linearly distributed throughout the remaining colormap colors.
Although it is conventional to display greyscale images using a greyscale colormap, it is possible to use other colormaps. For example, the following statements display the greyscale image I in shades of blue and green:
imagesc(I,[0 1]); colormap(winter);
To display a matrix A with an arbitrary range of values as a greyscale image, use the single-argument form of imagesc. With one input argument, imagesc maps the minimum value of the data matrix to the first colormap entry, and maps the maximum value to the last colormap entry. For example, these two lines are equivalent:
imagesc(A); colormap(grey)
imagesc(A,[min(A(:)) max(A(:))]); colormap(grey)
RGB (Truecolor) Images
An RGB image, sometimes referred to as a truecolor image, is stored as an m×n×3 data array that defines red, green, and blue color components for each individual pixel. RGB images do not use a palette. The color of each pixel is determined by the combination of the red, green, and blue intensities stored in each color plane at the pixel's location. Graphics file formats store RGB images as 24-bit images, where the red, green, and blue components are 8 bits each. This yields a potential of 16 million colors. The precision with which a real-life image can be replicated has led to the nickname "truecolor image."
An RGB MATLAB array can be of class double, uint8, or uint16. In an RGB array of class double, each color component is a value between 0 and 1. A pixel whose color components are (0,0,0) is displayed as black, and a pixel whose color components are (1,1,1) is displayed as white. The three color components for each pixel are stored along the third dimension of the data array. For example, the red, green, and blue color components of the pixel (10,5) are stored in RGB(10,5,1), RGB(10,5,2), and RGB(10,5,3), respectively.
To display the truecolor image RGB, use the image function:
image(RGB)
The next figure shows an RGB image of class double.
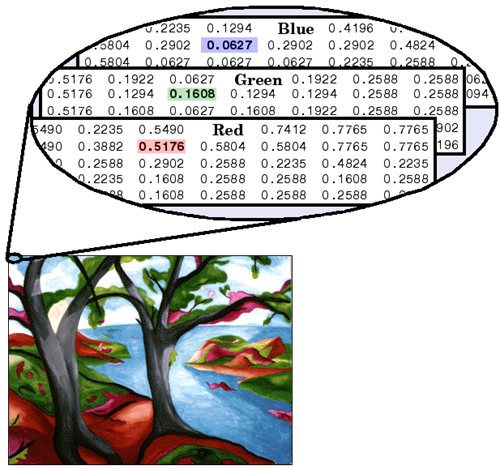
To determine the color of the pixel at (2,3), look at the RGB triplet stored in (2,3,1:3). Suppose (2,3,1) contains the value 0.5176, (2,3,2) contains 0.1608, and (2,3,3) contains 0.0627. The color for the pixel at (2,3) is
0.5176 0.1608 0.0627
Two-Dimensional Image
image — Creates a two-dimensional image.
iamgesc — Creates a two-dimensional image with scaled colors.
| Syntax | Description |
|---|---|
| image(C) |
Displays the data in array C as an image. Each element of C specifies the color for 1 pixel of the image. The resulting image is an m×n grid of pixels where m is the number of rows and n is the number of columns in C. The row and column indices of the elements determine the centers of the corresponding pixels. |
| imagesc(C) | Displays the data in array C as an image that uses the full range of colors in the colormap. |
| image(x,y,C) imagesc(x,y,C) |
Specifies the image location. Use x and y to specify the locations of the corners corresponding to C(1,1) and C(m,n). To specify both corners, set x and y as two-element vectors. To specify the first corner and let image determine the other, set x and y as scalar values. The image is stretched and oriented as applicable. |
| image('CData',C) imagesc('CData',C) |
Adds the image to the current axes without replacing existing plots. This syntax is the low-level version of image(C)/ imagesc(C). |
| image('XData',x,'YData',y,'CData',C) imagesc('XData',x,'YData',y,'CData',C) |
Specifies the image location. This syntax is the low-level version of image(x,y,C)/ imagesc(x,y,C). |
| image(___, Name, Value) imagesc(___, Name, Value) |
Specifies image properties using one or more name-value pair arguments. You can specify image properties with any of the input argument combinations in the previous syntaxes. For a list of image properties and descriptions, see Image Properties. |
| imagesc(___,clims) | Specifies the data values that map to the first and last elements of the colormap. Specify clims as a two-element vector of the form [cmin cmax], where values less than or equal to cmin map to the first color in the colormap and values greater than or equal to cmax map to the last color in the colormap. Specify clims after name-value pair arguments. |
| image(ax,___) imagesc(ax,___) |
Creates the image in the axes specified by ax instead of in the current axes (gca). The option ax can precede any of the input argument combinations in the previous syntaxes. |
| im = image(__) im = imagesc(__) |
Returns the Image object created. Use im to set properties of the image after it is created. You can specify this output with any of the input argument combinations in the previous syntaxes. For a list of image properties and descriptions, see Image Properties. |
Display Image of Matrix Data
Create matrix C. Display an image of the data in C. Add a colorbar to the graph to show the current colormap.
C = [0 2 4 6; 8 10 12 14; 16 18 20 22];
image(C)
colorbar
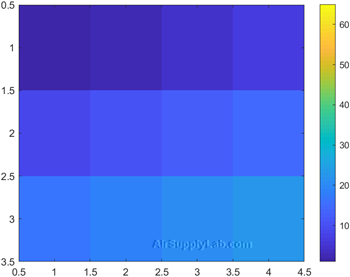
By default, the CDataMapping property for the image is set to 'direct' so image interprets values in C as indices into the colormap. For example, the bottom right pixel corresponding to the last element in C, 22, uses the 22nd color of the colormap.
Scale the values to the full range of the current colormap by setting the CDataMapping property to 'scaled' when creating the image.
image(C,'CDataMapping','scaled')
colorbar
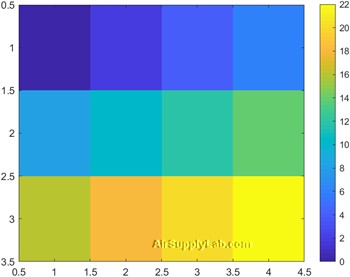
Alternatively, you can use the imagesc function to scale the values instead of using image(C,'CDataMapping','scaled'). For example, use imagesc(C).
C = [0 2 4 6; 8 10 12 14; 16 18 20 22];
imagesc(C)
colorbar
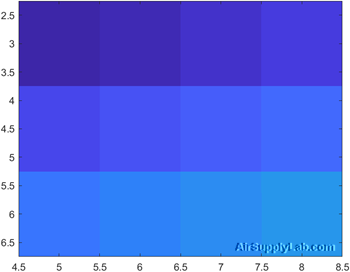
Control Image Placement
Place the image so that it lies between 5 and 8 on the x-axis and between 3 and 6 on the y-axis.
x = [5 8];
y = [3 6];
C = [0 2 4 6; 8 10 12 14; 16 18 20 22];
image(x,y,C)
x = [5 8];
y = [3 6];
C = [0 2 4 6; 8 10 12 14; 16 18 20 22];
imagesc(x,y,C)
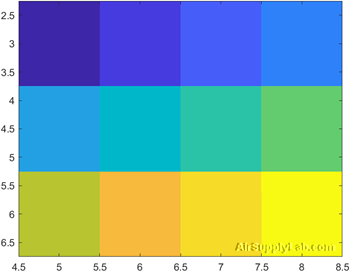
Notice that the pixel corresponding to C(1,1) is centered over the point (5,3). The pixel corresponding to C(3,4) is centered over the point (8,6). image positions and orients the rest of the image between those two points.
Colormap
A colormap is matrix of values between 0 and 1 that define the colors for graphics objects such as surface, image, and patch objects. MATLAB draws the objects by mapping data values to colors in the colormap.
Colormaps can be any length, but must be three columns wide. Each row in the matrix defines one color using an RGB triplet. An RGB triplet is a three-element row vector whose elements specify the intensities of the red, green, and blue components of the color. The intensities must be in the range [0, 1]. A value of 0 indicates no color and a value of 1 indicates full intensity. For example, this command creates a colormap that has five colors: black, red, green, blue, and white.
| Syntax | Description |
|---|---|
| colormap map | Sets the colormap for the current figure to one of the predefined colormaps. |
| colormap(map) | Sets the colormap for the current figure to the colormap specified by map. |
| colormap(target,map) | Sets the colormap for the figure, axes, or chart specified by target, instead of for the current figure. |
| cmap = colormap | Returns the colormap for the current figure as a three-column matrix of RGB triplets. |
| cmap = colormap(target) | Returns the colormap for the figure, axes, or chart specified by target. |
Colormap Name
Colormap Name
The following table lists the predefined colormaps.
| Colormap name | Color Scale |
|---|---|
| parula |  |
| jet |  |
| hsv |  |
| hot |  |
| cool |  |
| spring |  |
| summer |  |
| autumn |  |
| winter |  |
| Colormap name | Color Scale |
|---|---|
| grey |  |
| bone |  |
| copper |  |
| pink |  |
| lines |  |
| colorcube |  |
| prism |  |
| flag |  |
| white |  |
Three-Column Matrix
To create a custom colormap, specify map as a three-column matrix of RGB triplets where each row defines one color. An RGB triplet is a three-element row vector whose elements specify the intensities of the red, green, and blue components of the color. The intensities must be in the range [0,1]. For example, this matrix defines a colormap containing five colors.
map = [0.2 0.1 0.5
0.1 0.5 0.8
0.2 0.7 0.6
0.8 0.7 0.3
0.9 1 0];
This table lists the RGB triplet values for common colors.
| Color | RGB Triplet |
|---|---|
| yellow | [1 1 0] |
| magenta | [1 0 1] |
| cyan | [0 1 1] |
| red | [1 0 0] |
| Color | RGB Triplet |
|---|---|
| green | [0 1 0] |
| blue | [0 0 1] |
| white | [1 1 1] |
| black | [0 0 0] |
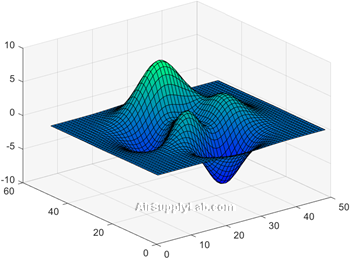
Change Colormap for Figure
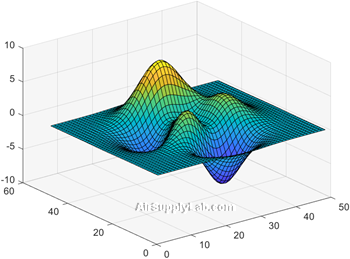
Create a surface plot and set the colormap to winter.
surf(peaks)
colormap winter
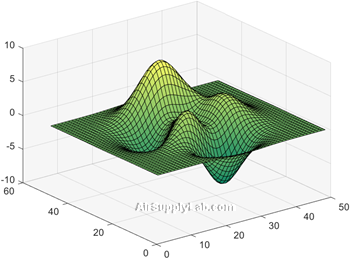
Change the colormap for the current figure to summer.
surf(peaks)
colormap summer
Now set the colormap back to your system's default value. If you have not specified a different default value, then the default colormap is parula.
surf(peaks)
colormap default
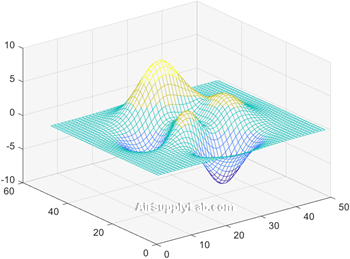
Specify Number of Colors for Colormap
Specify the number of colors used in a colormap by passing an integer as an input argument to the built-in colormap. Use five colors from the parula colormap.
mesh(peaks)
colormap(parula(5))
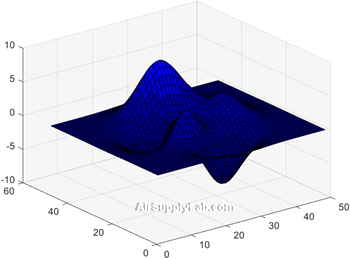
Create Custom Colormap
Create a custom colormap by defining a three-column matrix of values between 0.0 and 1.0. Each row defines a three-element RGB triplet. The first column specifies the red intensities. The second column specifies the green intensities. The third column specifies the blue intensities.
Use a colormap of blue values by setting the first two columns to zeros.
map = [0 0 0.3
0 0 0.4
0 0 0.5
0 0 0.6
0 0 0.8
0 0 1.0];
surf(peaks)
colormap(map)
Return Colormap Values for Specific Axes
Return the colormap values for a specific axes by passing its axes handle to the colormap function.
Create a figure with two subplots and return the axes handles, ax1 and ax2. Add a filled contour plot to each axes and use a different colormap for each axes.
ax1 = subplot(2,1,1);
contourf(peaks)
colormap(ax1,hot(8))
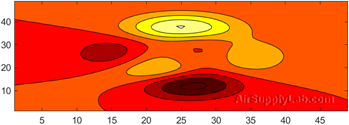
ax2 = subplot(2,1,2);
contourf(peaks)
colormap(ax2,pink)
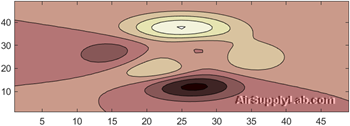
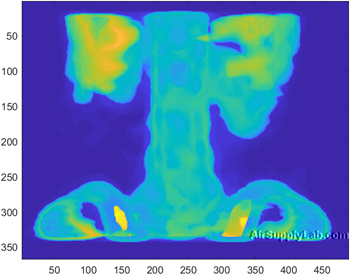
Change Colormap for Figure with Image
Load the spine data set that returns the image X. Display X using the imagesc function.
Using the default parula colormap.
load spine
imagesc(X)
Use the bone colormap that looks more like a traditional X-ray.
colormap(bone)
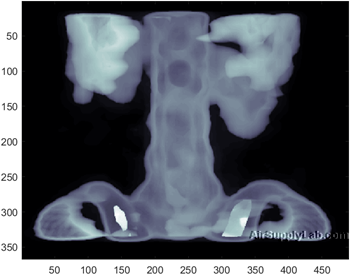
The spine file also includes a custom colormap, called map. , which happens to correspond to the bone coloemap,. Therefore, the colormap(map) will display the same image as above.
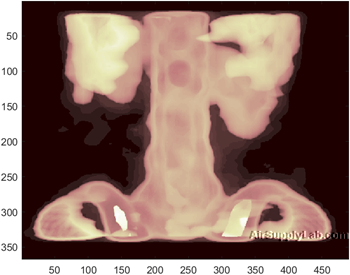
Use the pink colormap to display the image with pink color.
colormap(pink)
Read Image File
imread — Read image from graphics file.
| Syntax | Description |
|---|---|
| A = imread(filename) | Reads the image from the file specified by filename, inferring the format of the file from its contents. If filename is a multi-image file, then imread reads the first image in the file. |
| A = imread(filename,fmt) | Additionally specifies the format of the file with the standard file extension indicated by fmt. If imread cannot find a file with the name specified by filename, it looks for a file named filename.fmt. |
| A = imread(___,idx) | Reads the specified image or images from a multi-image file. This syntax applies only to GIF, PGM, PBM, PPM, CUR, ICO, TIF, and HDF4 files. You must specify a filename input, and you can optionally specify fmt. |
| A = imread(___,Name,Value) | Specifies format-specific options using one or more name-value pair arguments, in addition to any of the input arguments in the previous syntaxes. |
| [A,map] = imread(__) | Reads the indexed image in filename into A and reads its associated colormap into map. Colormap values in the image file are automatically rescaled into the range [0,1]. |
| [A,map,transparency] = imread(__) | Additionally returns the image transparency. This syntax applies only to PNG, CUR, and ICO files. For PNG files, transparency is the alpha channel, if one is present. For CUR and ICO files, it is the AND (opacity) mask. |
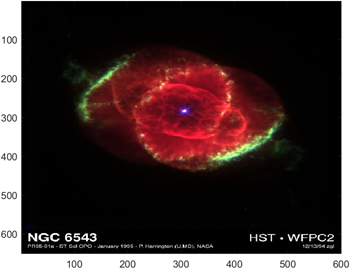
Read and Display Image
Read a sample image.
A = imread('ngc6543a.jpg');
imread returns a 650-by-600-by-3 array, A.
Display the image.
image(A)
load — load image file into MATLAB workspace
| Syntax | Description |
|---|---|
| load filename | Read an image (.mat file) into the MATLAB workspace. The file includes an indexed image matrix named X and a colormap named map. |
The MATLAB includes the built-in sample image file (.mat file) as the following table lists:
| Filename | Image Matrix (X) | Colormap (map) | Caption |
|---|---|---|---|
| cape.mat | 360×360 | 192×3 | NOAA altitude data for New England, including Cape Cod. |
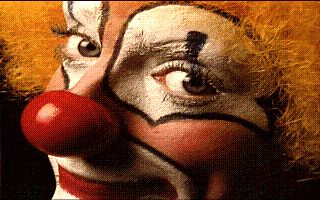
| clown.mat | 200×320 | 81×3 | |
| detail.mat | 359×371 | 64×3 | Detail from Durer's Melancolia, dated 1514 |
| durer.mat | 648×509 | 128×3 | Albrecht Durer's Melancolia. |
| earth.mat | 257×250 | 64×3 | Earth |
| flujet.mat | 400×300 | 64×3 | Astrophysical jet from NCSA. |
| gatlin.mat | 480×640 | 64×3 | 1964 photo from the Gatlinburg Conference on Numerical Algebra. |
| gatlin2.mat | 176×260 | 64×3 | |
| mandrill.mat | 480×500 | 220×3 | |
| spine.mat | 367×490 | 64×3 | |
| xpmndrll.mat | 192×200 | 64×3 |
Correct Image Aspect
When you use image function to display a image, the MATLAB will adjust the image to fill the figure window, so that the image may appear warped. We can force the correct aspect to be displayed by using the axis command.
Consider the built-in image of an earth, obtained with
load earth
Use image function to display the image.
image(X)
colormap(map)
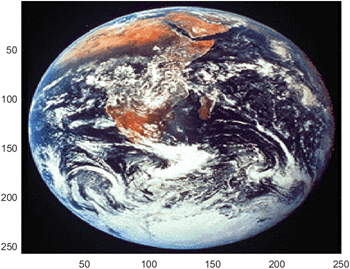
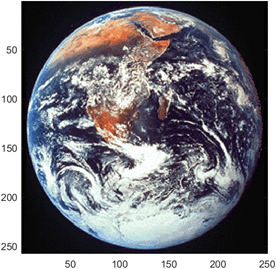
The image will be adjust to fill the figure window. It looks a little warped. Use axis command to display the correct aspect.
axis image
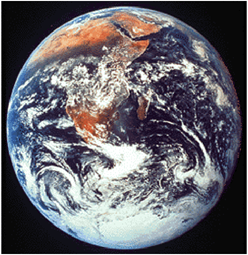
Remove the axis with the command:
Remove the axis with the command:
axis off
Display Image
imshow — Display image
| Syntax | Description |
|---|---|
| imshow(I) | Displays the greyscale image I in a figure. imshow uses the default display range for the image data type and optimizes figure, axes, and image object properties for image display. |
| imshow(I,[low high]) | Displays the greyscale image I, specifying the display range as a two-element vector, [low high]. |
| imshow(I,[]) | Displays the greyscale image I, scaling the display based on the range of pixel values in I. imshow uses [min(I(:)) max(I(:))] as the display range. imshow displays the minimum value in I as black and the maximum value as white. |
| imshow(RGB) | Displays the truecolor image RGB in a figure. |
| imshow(BW) | Displays the binary image BW in a figure. For binary images, imshow displays pixels with the value 0 (zero) as black and 1 as white. |
| imshow(X,map) | Displays the indexed image X with the colormap map. A colormap matrix can have any number of rows, but it must have exactly 3 columns. Each row is interpreted as a color, with the first element specifying the intensity of red, the second green, and the third blue. Color intensity can be specified on the interval [0,1]. |
| imshow(filename) | Displays the image stored in the graphics file specified by filename. |
| imshow(___,Name,Value) | Displays an image, using name-value pairs to control aspects of the operation. |
| himage = imshow(__) | Returns the image object created by imshow. |
Display greyscale, RGB, Indexed, or Binary Image
Display a greyscale, RGB (truecolor), indexed or binary image using imshow. MATLAB includes a TIF file, named corn.tif, that contains three images: a greyscale image, an indexed image, and a truecolor (RGB) image. This example creates a binary image from the greyscale image.
Display a greyscale Image
Read the greyscale image from the corn.tif file into the MATLAB workspace. The greyscale version of the image is the third image in the file.
corn_grey = imread('corn.tif',3);
Display the greyscale image using imshow.
imshow(corn_grey)

Display an Indexed Image
Read the indexed image from the corn.tif file into the MATLAB workspace. The indexed version of the image is the first image in the file.
[corn_indexed,map] = imread('corn.tif',1);
Display the indexed image using imshow.
imshow(corn_indexed,map)

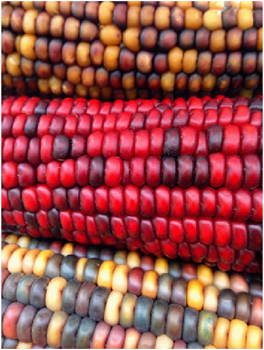
Display an RGB Image
Read the RGB image from the corn.tif file into the MATLAB workspace. The RGB version of the image is the second image in the file.
[corn_rgb] = imread('corn.tif',2);
Display the RGB image using imshow.
imshow(corn_rgb)
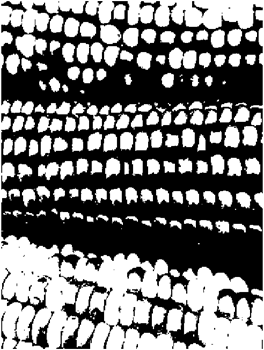
Display a Binary Image
Read the greyscale image from the corn.tif file into the MATLAB workspace and use thresholding to convert it into a binary image. The greyscale version of the image is the third image in the file.
[corn_grey] = imread('corn.tif',3);
Determine the mean value of pixels in the greyscale image.
meanIntensity = mean(corn_grey(:));
Create a binary image by thresholding, using the mean intensity value as the threshold.
corn_binary = corn_grey > meanIntensity;
Display the binary image using imshow.
imshow(corn_binary)
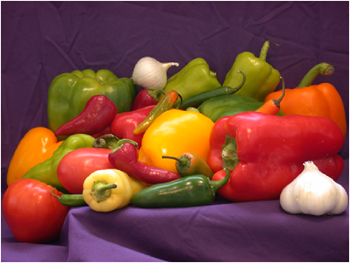
Display Image from File
Display an image stored in a file.
imshow('peppers.png');
Change Colormap of Displayed Image
Read a sample indexed image, corn.tif, into the workspace, and then display it.
[X,map] = imread('corn.tif');
imshow(X,map)
Change the colormap for the image using the colormap function and specifying the target axes as the first input argument. Use the original colormap without the red component.
newmap = map;
newmap(:,1) = 0;
colormap(gca,newmap)
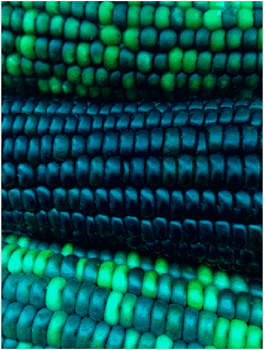
Image File Information
imfinf — Information about graphics file.
| Syntax | Description |
|---|---|
| info = imfinfo(filename) | Returns a structure whose fields contain information about an image in a graphics file, filename. The format of the file is inferred from its contents.
|
| info = imfinfo(filename,fmt) | Additionally looks for a file named filename.fmt, if MATLAB cannot find a file named filename. |
Return Information About Graphics File
Find information about the example image, ngc6543a.jpg.
info = imfinfo('ngc6543a.jpg');
The info structure contains the following information fields: Filename, FileModDate, FileSize, Format, FormatVersion, Width, Height, BitDepth, ColorType, FormatSignature, NumberOfSamples, CodingMethod, CodingProcess, and Comment.
To display information from the structure, for example CodingMethod, type info.CodingMethod in the command window.
info.CodingMethod
ans = 'Huffman'
To display all the properties in the structure, type info in the command window.
info
info = struct with fields:
Filename: 'C:\Program Files\MATLAB\R2019a\toolbox\matlab\demos\ngc6543a.jpg'
FileModDate: '01-Oct-1996 13:19:44'
FileSize: 27387
Format: 'jpg'
FormatVersion: ''
Width: 600
Height: 650
BitDepth: 24
ColorType: 'truecolor'
FormatSignature: ''
NumberOfSamples: 3
CodingMethod: 'Huffman'
CodingProcess: 'Sequential'
Comment: {'CREATOR: XV Version 3.00b Rev: 6/15/94 Quality = 75, Smoothing = 0↵'}
Write Image File
imwrite — Write image to graphics file.
| Syntax | Description |
|---|---|
| imwrite(A,'filename.fmt') | Writes image data A to the file specified by filename, inferring the file format from the extension fmt. imwrite creates the new file in your current folder. |
| imwrite(A,map,'filename.fmt') | Writes the indexed image in A and its associated colormap, map, to the file specified by filename.fmt. |
| imwrite(___,fmt) | Writes the image in the format specified by fmt, regardless of the file extension in filename. You can specify fmt after the input arguments in any of the previous syntaxes. |
| imwrite(___,Name,Value) | Specifies additional parameters for output GIF, HDF, JPEG, PBM, PGM, PNG, PPM, and TIFF files, using one or more name-value pair arguments. You can specify Name,Value after the input arguments in any of the previous syntaxes. |
For most formats:
- If A is of data type uint8, then imwrite outputs 8-bit values.
- If A is of data type uint16 and the output file format supports 16-bit data (JPEG, PNG, and TIFF), then imwrite outputs 16-bit values. If the output file format does not support 16-bit data, then imwrite returns an error.
- If A is a greyscale or RGB color image of data type double or single, then imwrite assumes that the dynamic range is [0,1] and automatically scales the data by 255 before writing it to the file as 8-bit values. If the data in A is single, convert A to double before writing to a GIF or TIFF file.
- If A is of data type logical, then imwrite assumes that the data is a binary image and writes it to the file with a bit depth of 1, if the format allows it. BMP, PNG, or TIFF formats accept binary images as input arrays.
- If A is an indexed image of data type double or single, then imwrite converts the indices to zero-based indices by subtracting 1 from each element, and then writes the data as uint8. If the data in A is single, convert A to double before writing to a GIF or TIFF file
Write greyscale Image to PNG
Write a 50×50 array of greyscale values to a PNG file in the current folder.
A = rand(50);
imagesc(A)
colormap(grey)
imwrite(A,'mygrey.png')

Write Indexed Image Data to PNG
Write an indexed image array and its associated colormap to a PNG file.
Load sample image data from the file, clown.mat.
load clown
The image array X and its associated colormap, map, are loaded into the MATLAB workspace.
Write the data to a new PNG file.
imwrite(X,map,'myclown.png')
imwrite creates the file, myclown.png, in your current folder.
View the new file by opening it outside of MATLAB.
Write Indexed Image with MATLAB Colormap
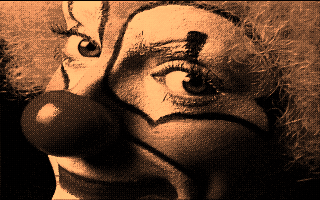
Write image data to a new PNG file with the built-in MATLAB colormap, copper.
Load sample image data from the file clown.mat.
load clown.mat
The image array X and its associated colormap, map, are loaded into the MATLAB workspace. map is a matrix of 81 RGB vectors.
Define a copper-tone colormap with 81 RGB vectors. Then, write the image data to a PNG file using the new colormap.
newmap = copper(81);
imwrite(X,newmap,'copperclown.png');
imwrite creates the file, copperclown.png, in your current folder.
View the new file by opening it outside of MATLA
Write Multiple Images to TIFF File
Write multiple images to a single multipage TIFF file.
Create two sets of random image data, im1 and im2.
im1 = rand(50,40,3);
im2 = rand(50,50,3);
Write the first image to a new TIFF file. Then, append the second image to the same file.
imwrite(im1,'myMultipageFile.tif')
imwrite(im2,'myMultipageFile.tif','WriteMode','append')
13.2 Graphic Objects
Plot Handles
Plot Handles
| Syntax | Description |
|---|---|
| h = plot(__) | Returns a handle to a Patch object. |
Assigning a plot a name (called a handle) allows us to easily ask MATLAB to list the plotted object's properties.
Specify Properties for Current Plot
Create a simple plot and assign a handle to it:
clear,close all, clc, clf
x = linspace(-10,10);
y = cos(x);
h = plot(x,y);
title('Trigonometric Function Plot')
xlabel('angle, radians'), ylabel('cos(x)')
The variable h is the handle for the plot. We can change the properties of the graphics object with either dot notation or set function.
set(h,'Color','red') % or
h.Color = 'red';
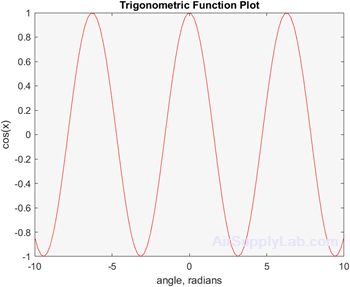
Figure Handles
Figure Handles
| Syntax | Description |
|---|---|
| f = figure(__) | Returns the Figure object. Use f to query or modify properties of the figure after it is created. |
| fig = gcf | Returns the current figure handle. If a figure does not exist, then gcf creates a figure and returns its handle. You can use the figure handle to query and modify figure properties. |
We can also specify an object name (handle) for the figure window.
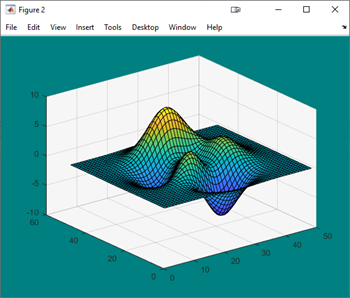
Specify Properties for Current Figure
Set the background color and remove the toolbar for the current figure. Use the gcf command to get the current figure handle.
surf(peaks)
fig = gcf; % current figure handle
fig.Color = [0 0.5 0.5];
fig.ToolBar = 'none';
Axes Handles
Axes Handles
gca - Get Current Axes or Chart
| Syntax | Description |
|---|---|
| ax = gca | Returns the current axes or chart for the current figure, which is typically the last one created or clicked with the mouse. Graphics functions, such as title, target the current axes or chart. Use ax to access and modify properties of the axes or chart. If axes or charts do not exist, then gca creates Cartesian axes. |
We can assign an object name (handle) to the axes by means of the gca (get current axes) function.
Specify Properties for Current Axes
Plot a sine wave.
x = linspace(0,10);
y = sin(4*x);
plot(x,y)
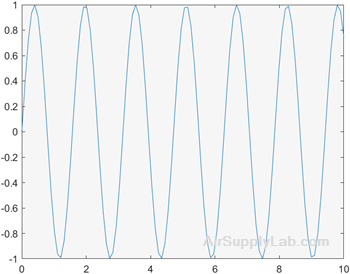
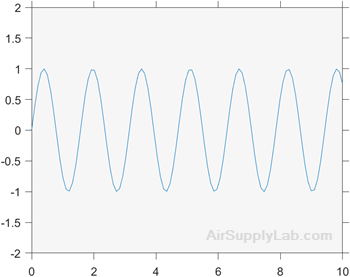
Set the font size, tick direction, tick length, and y-axis limits for the current axes. Use gca to refer to the current axes.
ax = gca; % current axes
ax.FontSize = 12;
ax.TickDir = 'out';
ax.TickLength = [0.02 0.02];
ax.YLim = [-2 2];
13.3 Animation
There are two techniques for creating an animation in MATLAB:
- Redrawing and erasing
- Creating a movie
Redrawing and Erasing
Update the properties of a graphics object and display the updates on the screen. This technique is useful for creating animations when most of the graph remains the same. For example, set the XData and YData properties repeatedly to move an object in the graph.
Creating an Animation
Create an animation for the equation: \(y = k x^2-2\),
In the code, it redraws the graph each time through the loop, instead of creating a new figure window each time. Reassign the y data points to the plot by updating YData object from the plot (The x values stay the same).
close all; clear; clc;
x = -10:0.01:10; % Define the x-values
k = -1; % Set an initial value of k
y = k*x.^2 - 2; % Calculate the first set of y-values
h = plot(x,y); %Create the figure and assign
grid on
axis([-10,10,-100,100]) % Specify the axes
while k - 1 % Start a loop
k = k + 0.01; % Increment k
y = k*x.^2 - 2; % Recalculate y
h.YData = y; % Reassign the y
drawnow % Redraw the graph. now
end
Consider modeling a ball rolling up and over a sine function.
clear, clc
theta = linspace(-pi/2,pi/2,1000); % Define 'hill' parameters
x = linspace(0,20,1000);
y = 20 * cos(theta);
plot(x,y) % Create the plot of the sine wave
axis([-1,21,-1,21]) % Specify the axis
hold on
Next, create a circular object, which will move during the animation.
theta2 = linspace(-pi,pi); % Define parameters used to draw the circle
xc = cos(theta2);
yc = -sin(theta2);
t = patch(xc, yc, 'red'); % Create a circular object
hold off
Finally, create a loop to redraw the ball.
for j = 1:length(theta)
xnew = xc + x(j); % Define new circle position
ynew = yc + y(j);
t.XData = xnew; % update data properties
t.YData = ynew;
drawnow % Display updates
end
Movies
Create an Animated GIF
Draw a series of plots, capture them as images, and write them into one animated GIF file.
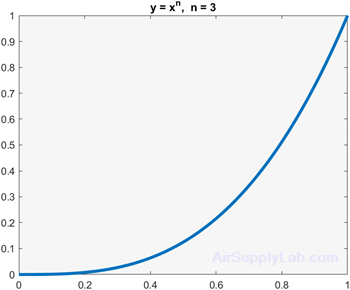
Plot for \(y = {x^n}\) for \(n = 3\).
x = 0:0.01:1;
n = 3;
y = x.^n;
plot(x,y,'LineWidth',3)
title(['y = x^n, n = ' num2str(n) ])
Capture a series of plots for increasing values of \(n\).
n = 1:0.5:5;
nImages = length(n);
fig = figure;
for idx = 1:nImages
y = x.^n(idx);
plot(x,y,'LineWidth',3)
title(['y = x^n, n = ' num2str( n(idx)) ])
drawnow
frame = getframe(fig);
im{idx} = frame2im(frame);
end
close;
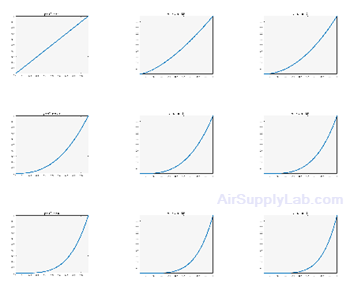
Display the series of images in one figure.
figure;
for idx = 1:nImages
subplot(3,3,idx)
imshow(im{idx});
end
Save the nine images into a GIF file. Because three-dimensional data is not supported for GIF files, call rgb2ind to convert the RGB data in the image to an indexed image A with a colormap map. To append multiple images to the first image, call imwrite with the name-value pair argument 'WriteMode','append'.
filename = 'testAnimated.gif'; % Specify the output file name
for idx = 1:nImages
[A,map] = rgb2ind(im{idx},256);
if idx == 1
imwrite(A,map,filename,'gif','LoopCount',Inf,'DelayTime',1);
else
imwrite(A,map,filename,'gif','WriteMode','append','DelayTime',1);
end
end
imwrite writes the GIF file to your current folder. Name-value pair 'LoopCount',Inf causes the animation to continuously loop. 'DelayTime',1 specifies a 1-second delay between the display of each image in the animation.
13.4 Other Visualization Techniques
Questions
You just need to submit the final figure for each question.
- Create a plot of the function: \(y = \sin (x)\) for x from \( - 2\pi \) to \( + 2\pi \)
Assign the plot an object name (handle), and use the handle with appropriate dot nomenclature to change the following properties (if you aren't sure what the object name is for a given property, use the get function to see a list of available property names):- Line color from blue to green
- Line style to dashed
- Line width to 2
- Assign a handle to the figure created in Question 1, and use the dot nomenclature to change the following properties (if you aren't sure what the object name is for a given property, use the get function to see a list of available property names):
- Figure background color to red
- Figure name to "A Sine Function"
- Assign a handle to the axes created in Question 1, and use dot nomenclature to change the following properties (if you aren't sure what the object name is for a given property, use the get function to see a list of available property names):
- Background color to blue
- x-axis scale to log
- Create an animation of the following pesudo code:
Let x vary from \( -2\pi \) to \( +2\pi \)
Let \( y = sin(x) \)
Mesh x and y: [x,y] = meshgrid(x,y);
Let a be the animation variable from 0 to \(8\pi\) with increment \(\pi / 10\).
Using a for-loop from 1 to the length of the a
Let \( z = sin(x-a) cos(y-a) \)
Draw the z value using surf(z) function
Using drawnow function to update the graphic.
(Optional) You can add a delay function: pause(0.1)